ZOD Frames
The ZOD Frames dataset consists of 100k annotated camera-LiDAR pairs, along with ±1-second surrounding LiDAR, and high-precision GNSS. For more detailed information about the sensor setup please visit the Sensor setup section on the Home page.
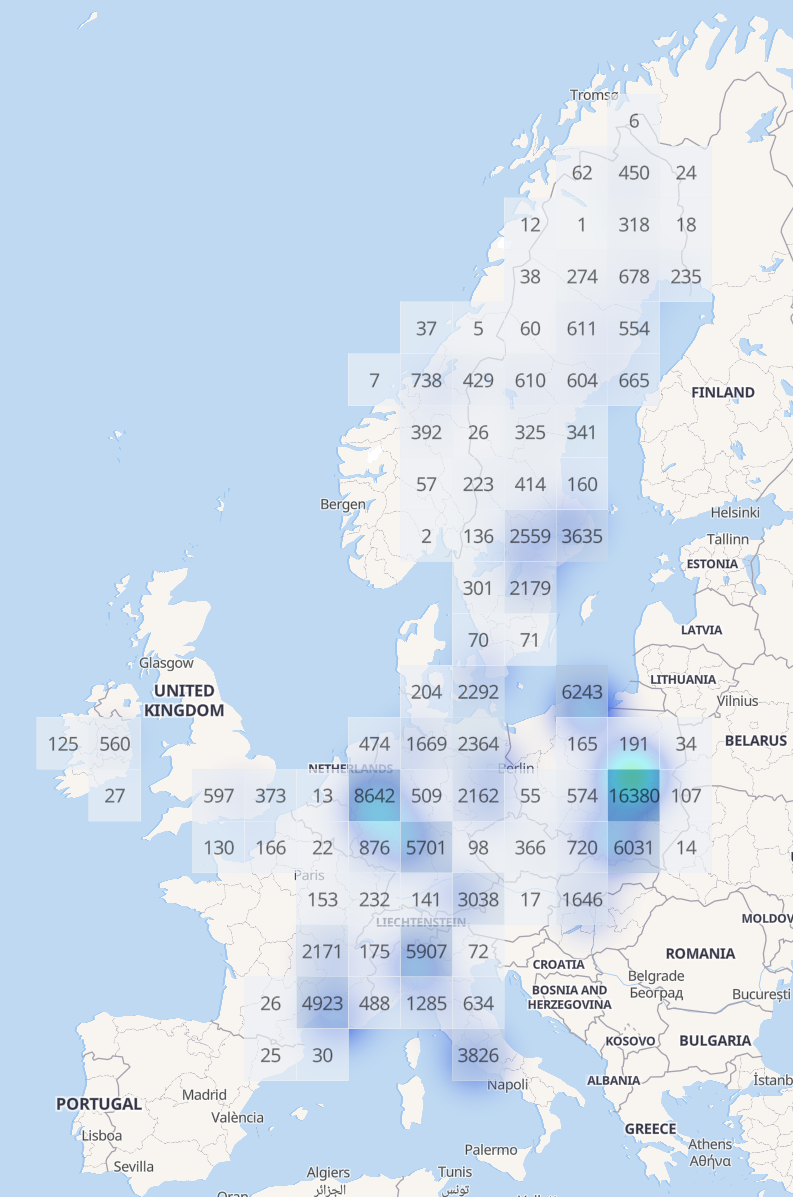
ZOD Frames is a highly diverse dataset, with data collected from 14 European countries over two years. The geographical distribution is shown in the figure to the right and can be seen ranging from the snowy parts of northern Sweden to the sunny countryside of Italy.
To quantitatively evaluate the geographical diversity of our dataset, we made use of the diversity area metric1, defined as the union of all 75m (radius) diluted ego-poses in the dataset. Using this definition, ZOD Frames obtains an area metric of 705km², which could be compared to 5km², 17km², and 76km² for nuScenes2, Argoverse 23, and Waymo Open1 respectively. The dataset is also highly diverse in terms of time of day, road type, and weather, as shown in the figure below.

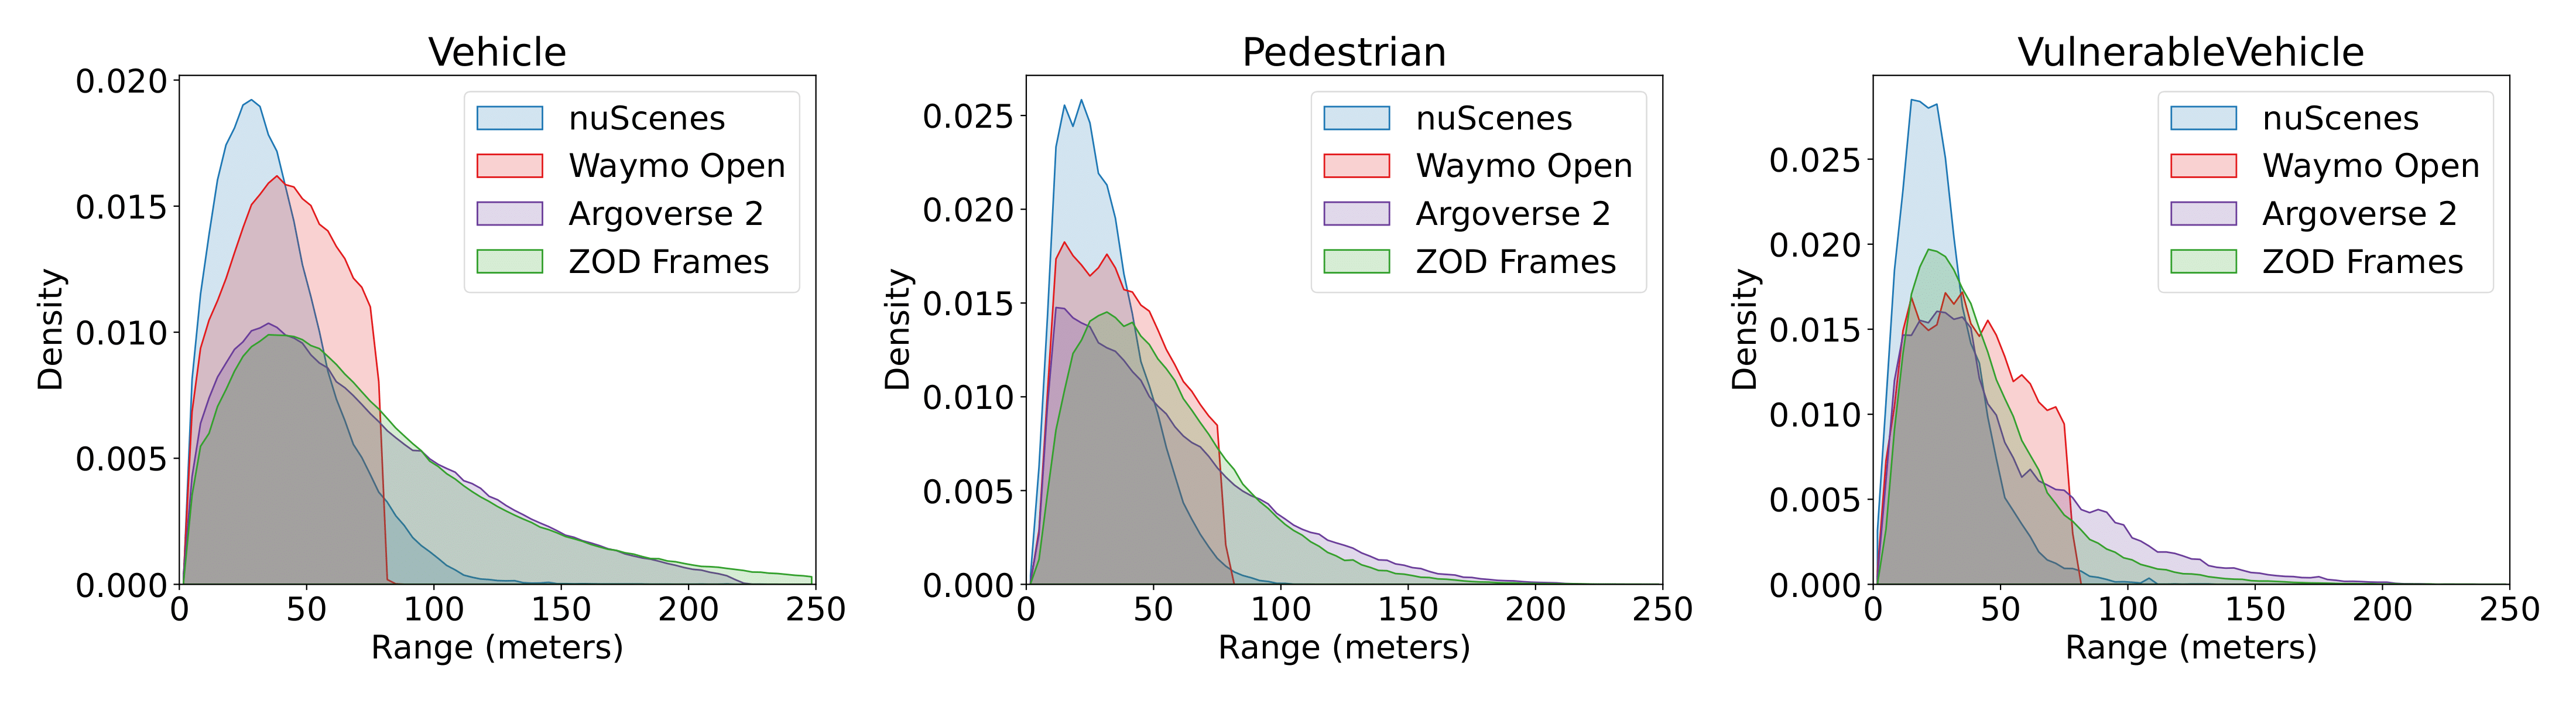
ZOD contains data from various driving conditions, ranging from slow-moving city driving to high-speed highway driving. To operate a vehicle safely when driving at speeds up to 130km/h (maximum ego-vehicle speed in ZOD is 133km/h), it is crucial to detect objects not only in your vicinity but also at longer distances. To accurately perceive the environment at distances required for high-speed driving, the ego-vehicle has to be equipped with sensors with sufficient resolution to enable long-range perception. In ZOD, we have an 8MP front-looking camera coupled with high-resolution LiDAR sensors, allowing annotation of objects up to 245m away.
To highlight this, we show the distribution of the distance to the ego-vehicle over all annotated objects in nuScenes2, Waymo Open1, Argoverse23, and ZOD Frames in the figure below, where we can see that ZOD Frames has a range distribution similar to the Argoverse 2 dataset, with the exception of having a longer tail for Vehicle and a lower density for distant VulnereableVehicle.
Annotation

The ZOD Frames dataset is fully annotated (i.e., every Frame) for the Objects, Lanes, and Road Condition annotation tasks. Moreover, roughly 67% of all Frames are also annotated for the Traffic Signs and Ego Road annotation tasks, see the figure to the right. For more detail on each of the annotation tasks, please refer to the Annotation page.
Note that we provide annotations for the camera-LiDAR pairs, but not for the surrounding LiDAR data.
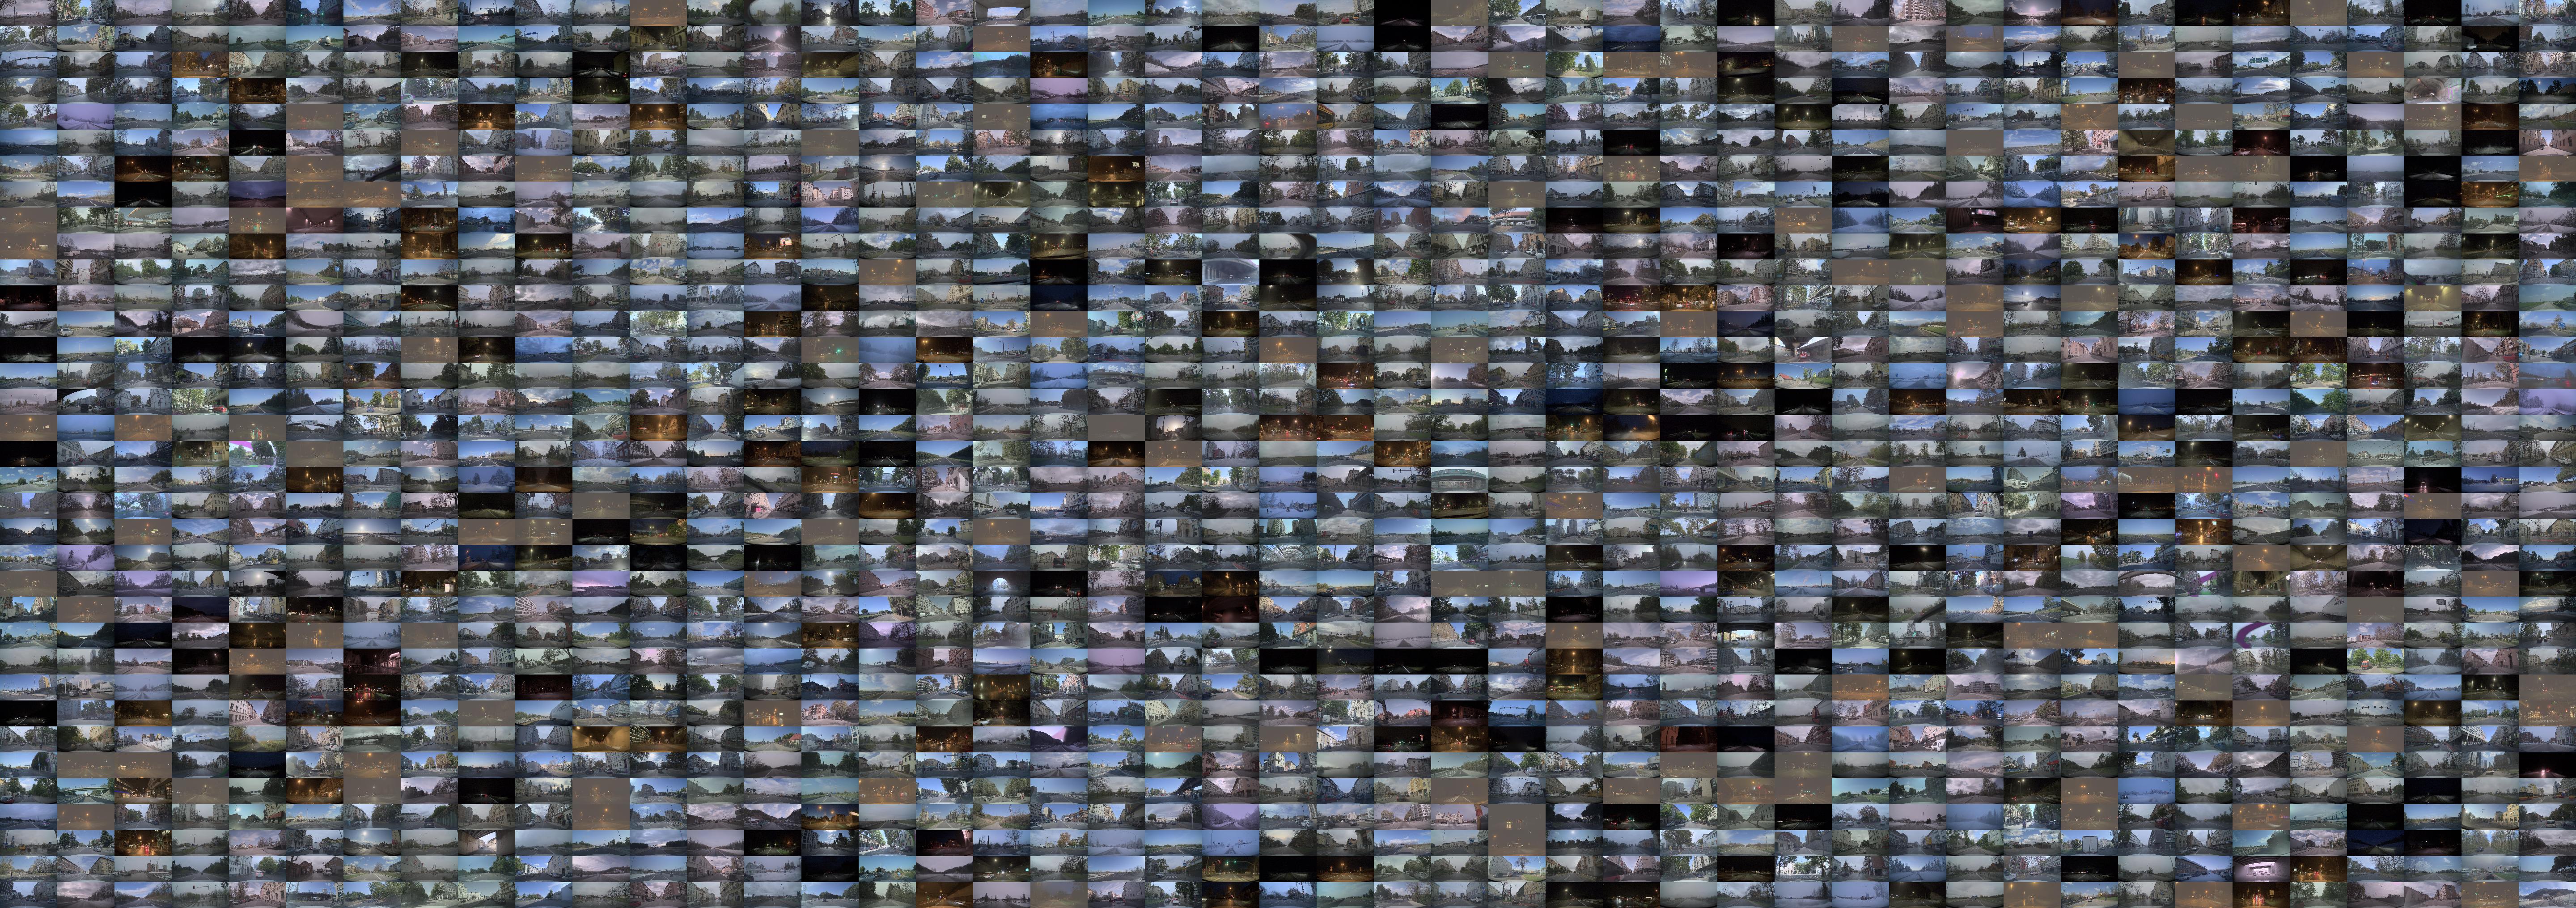
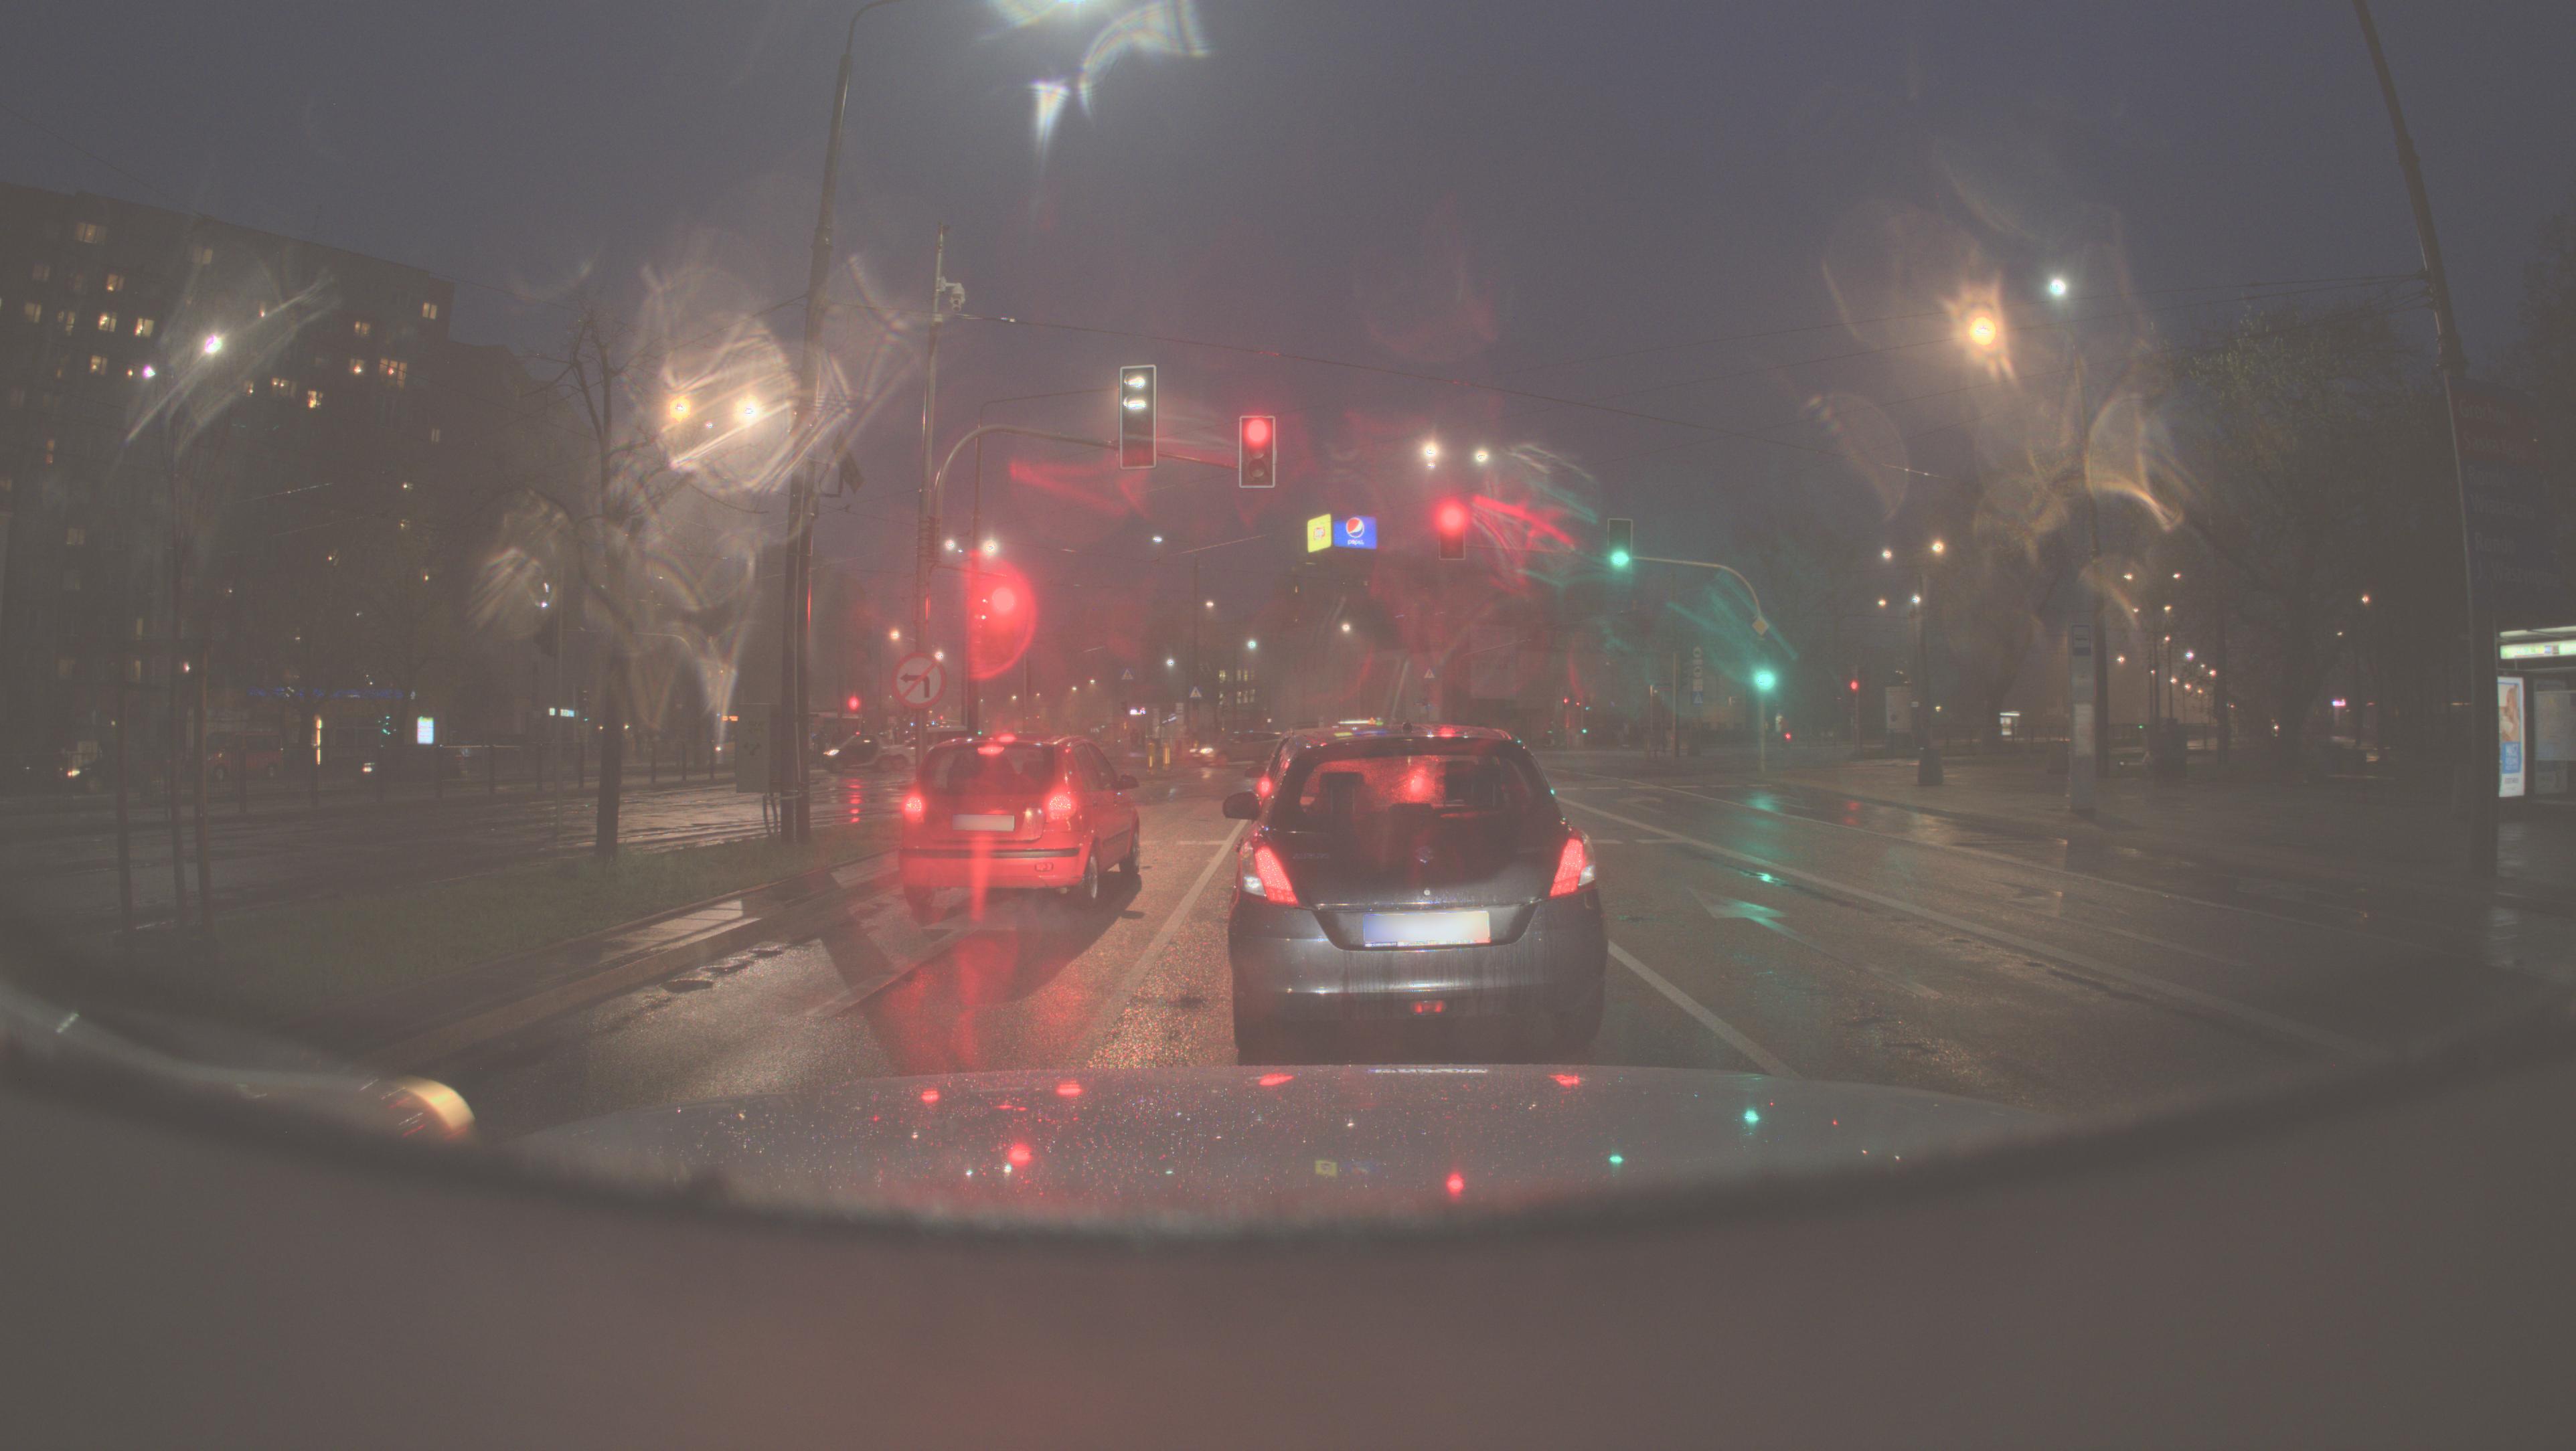
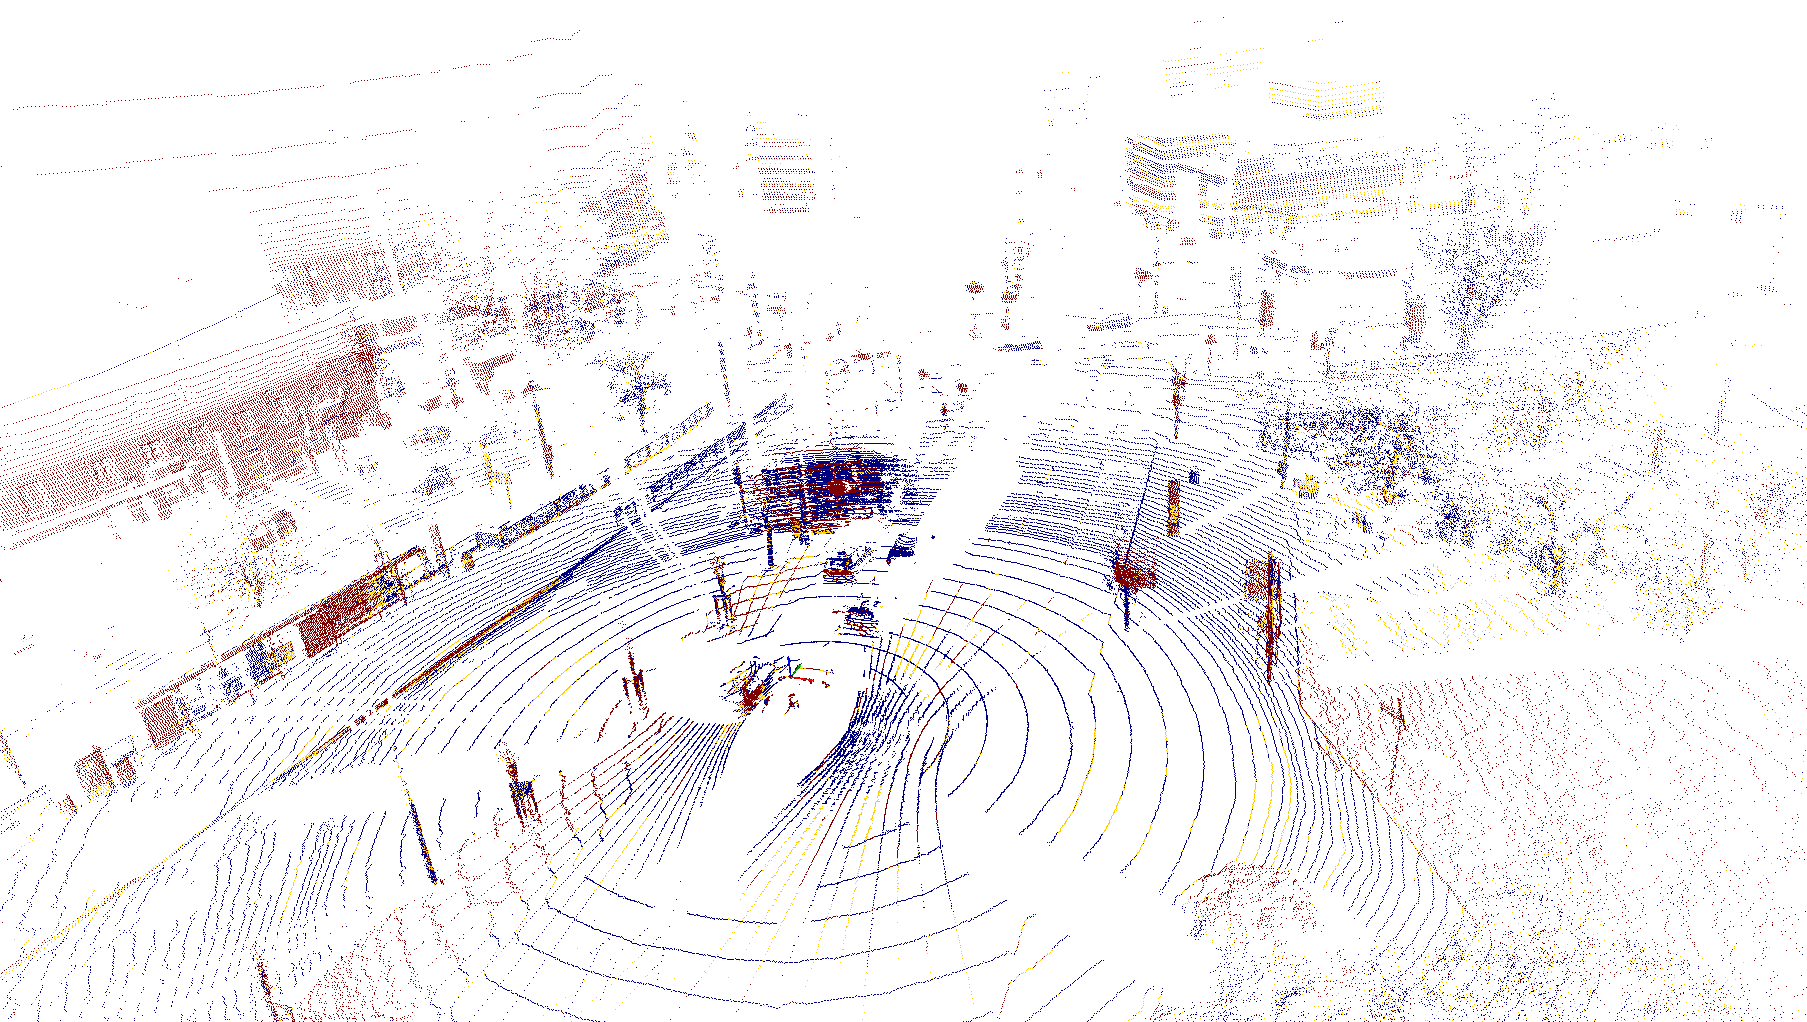
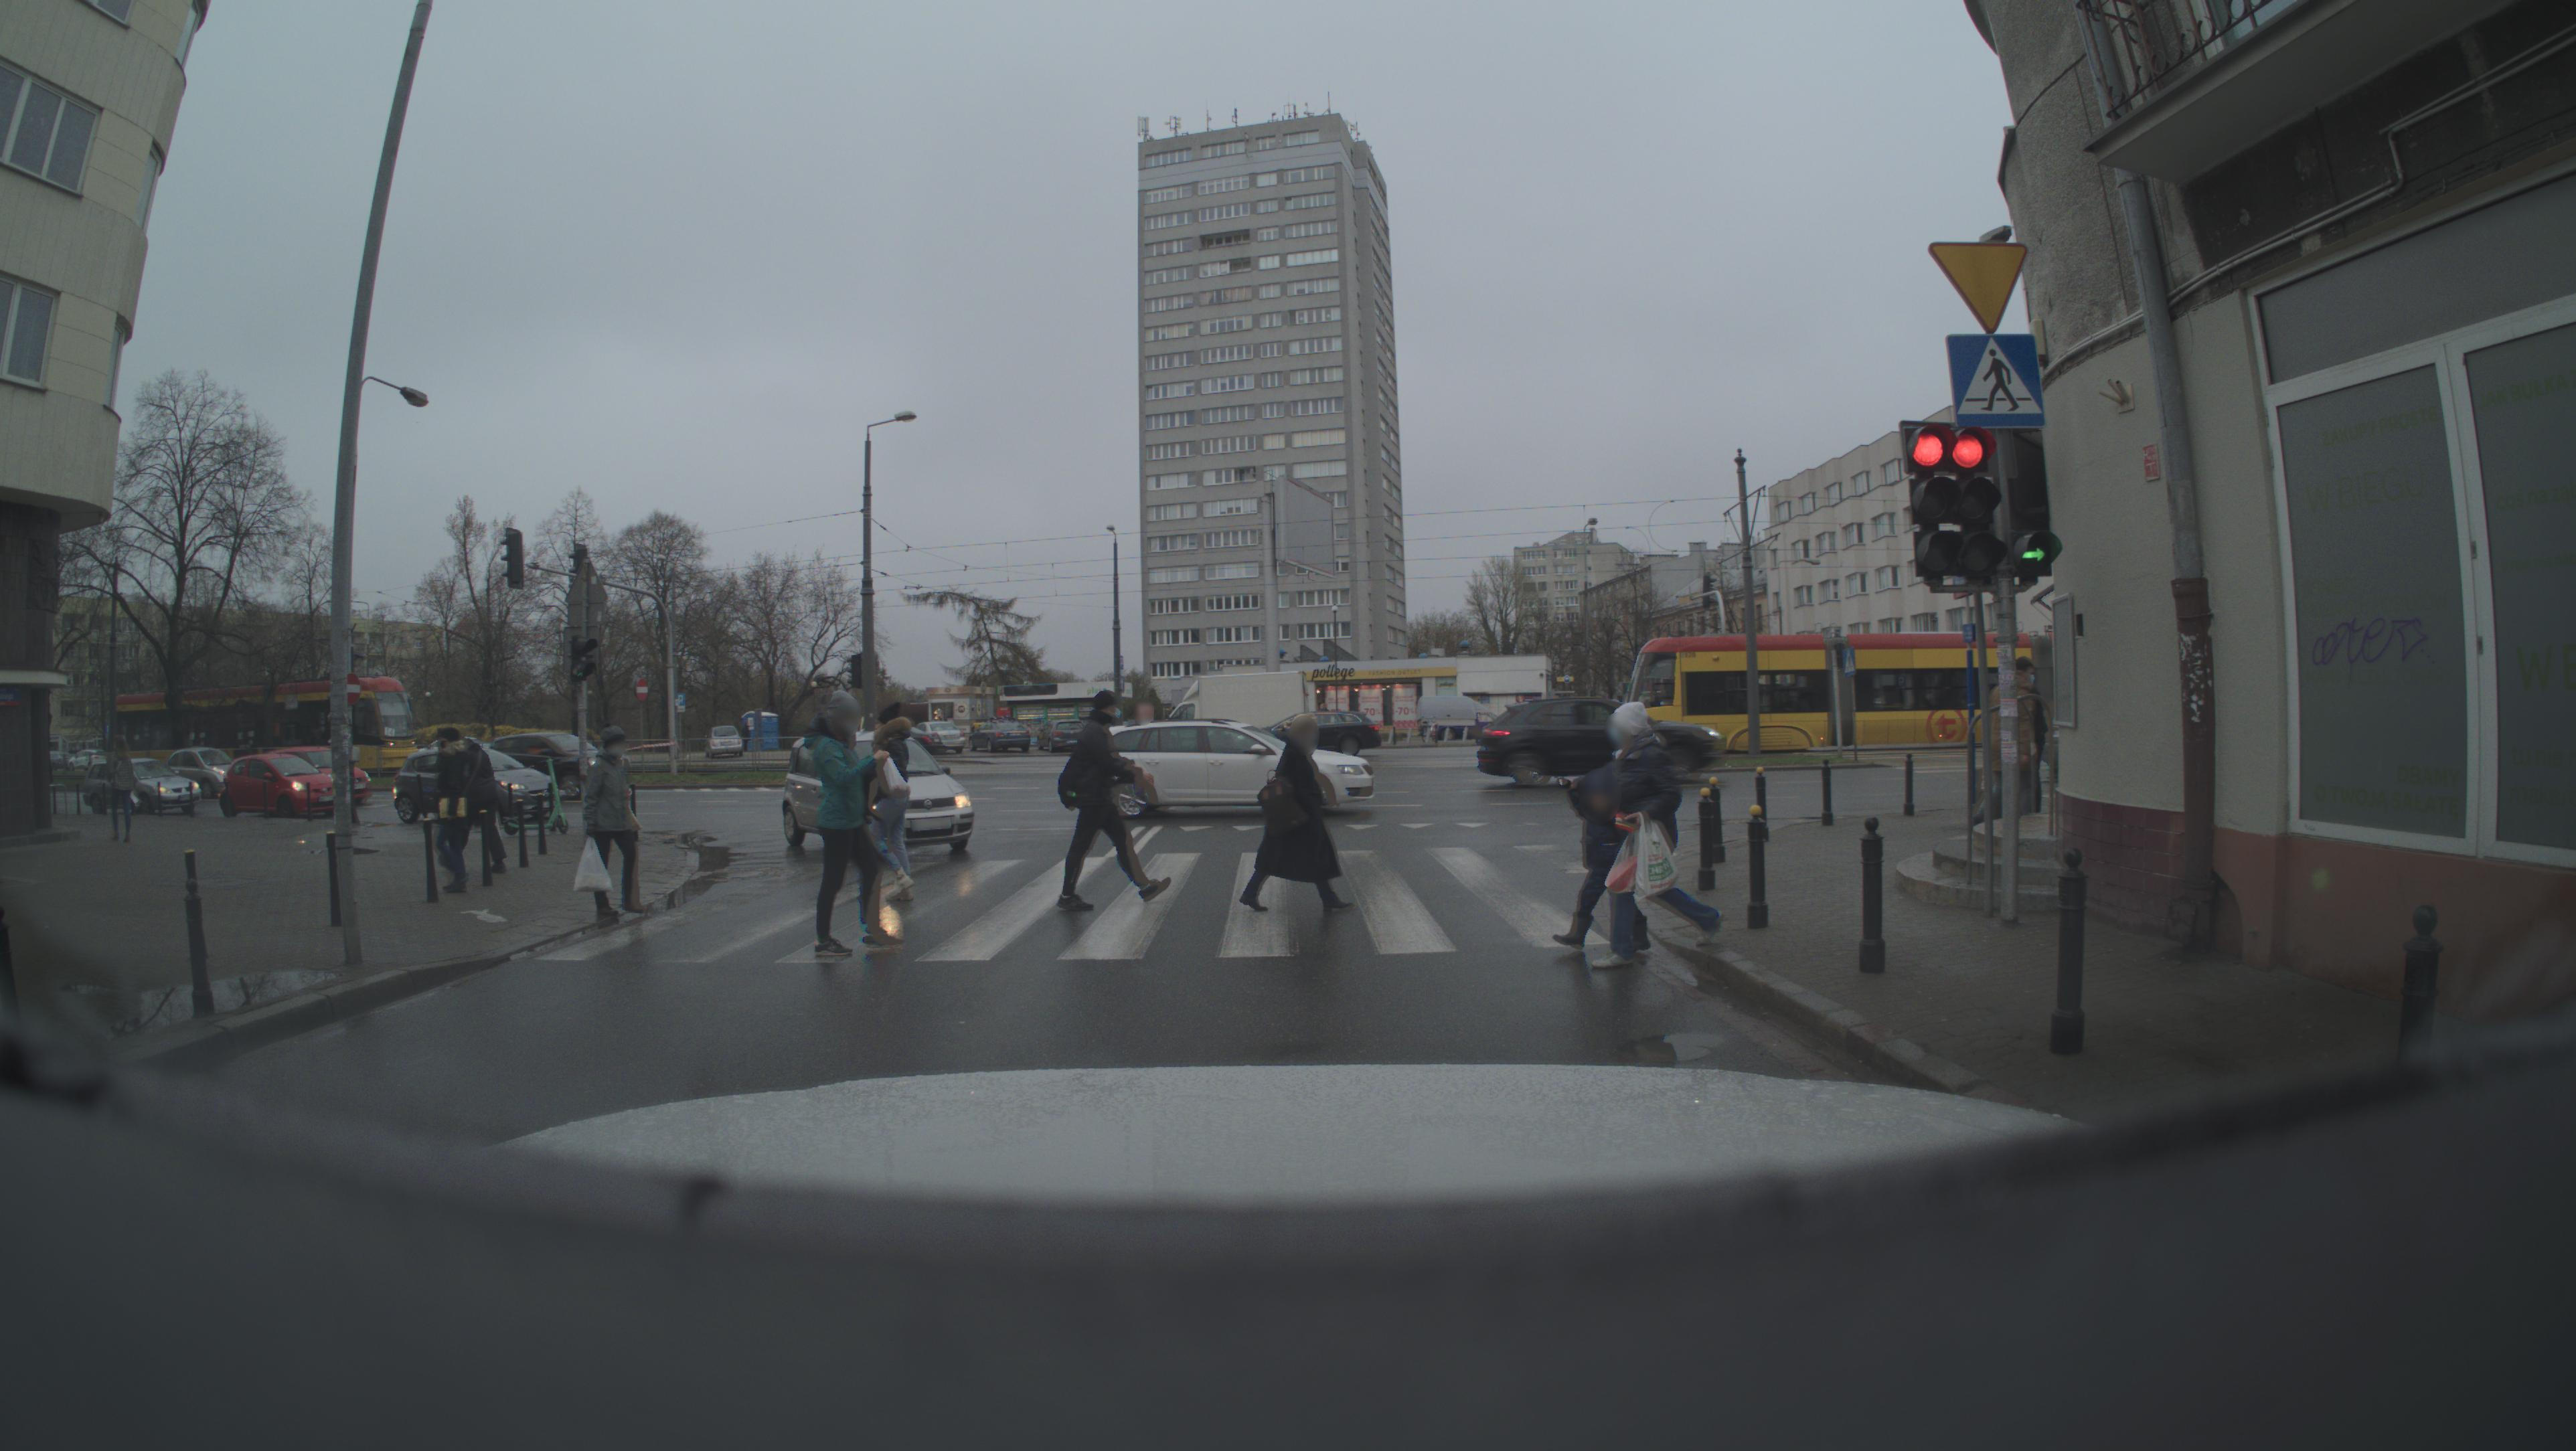
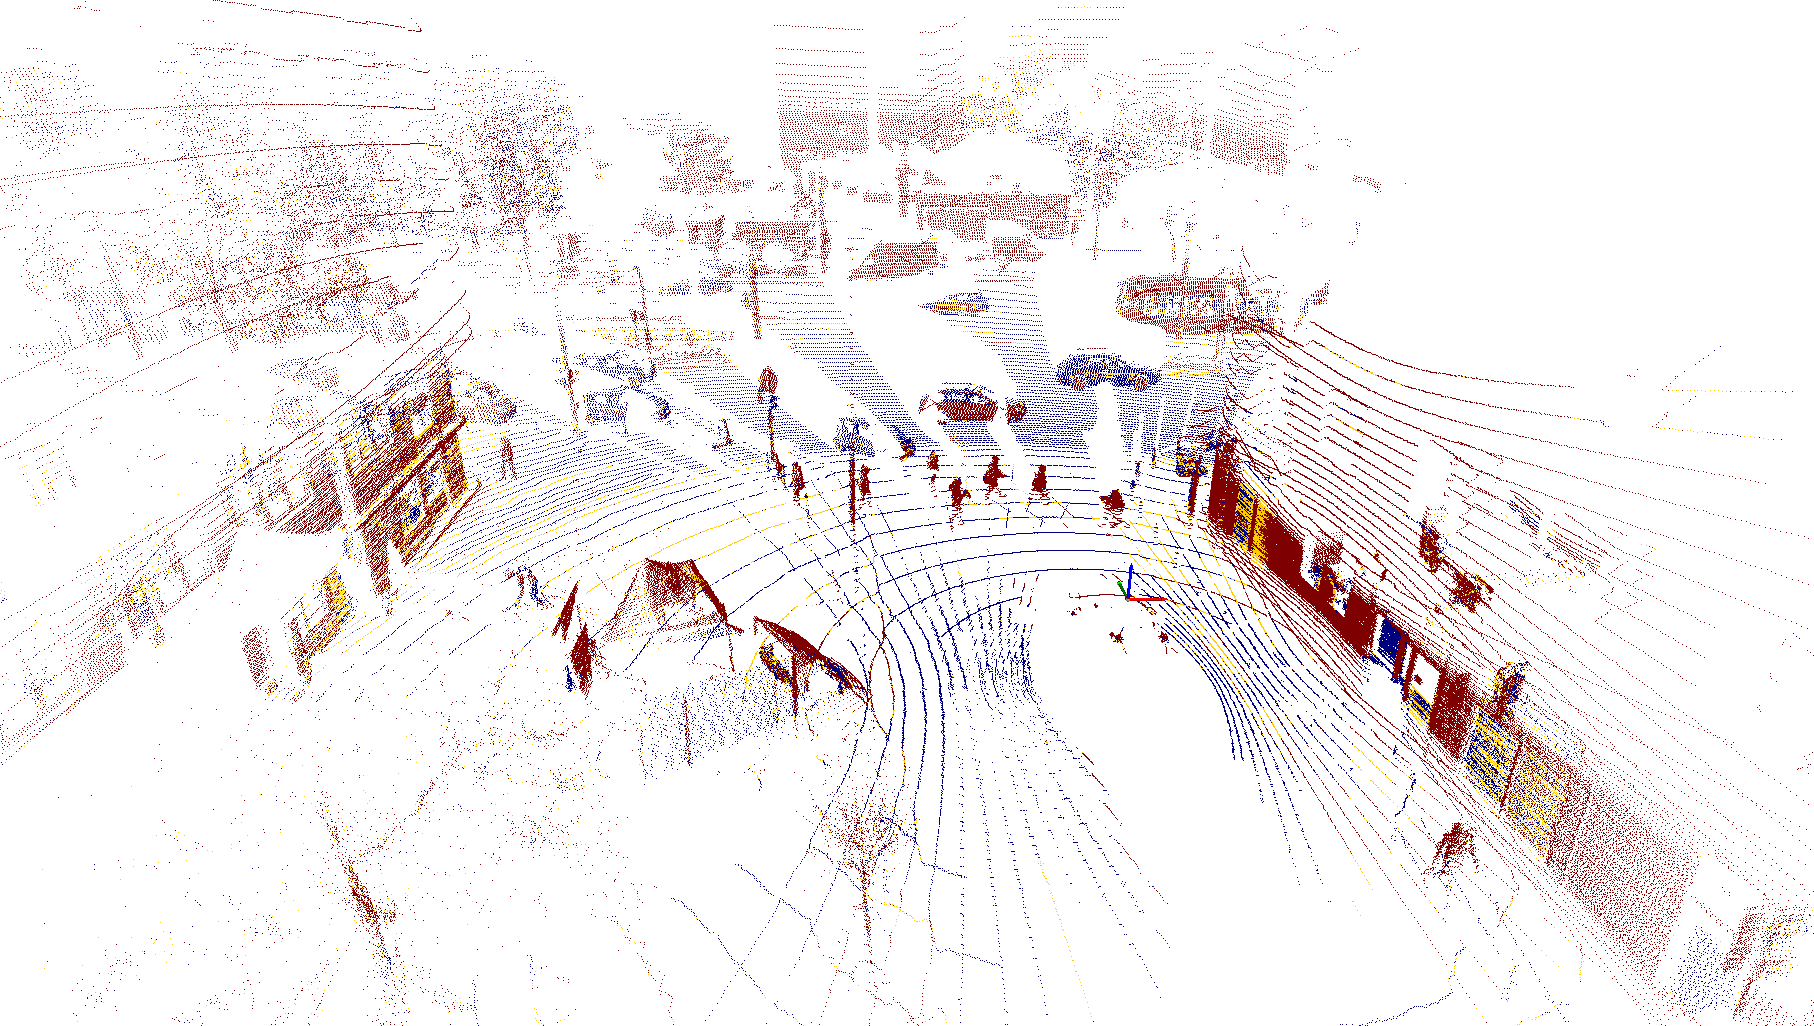
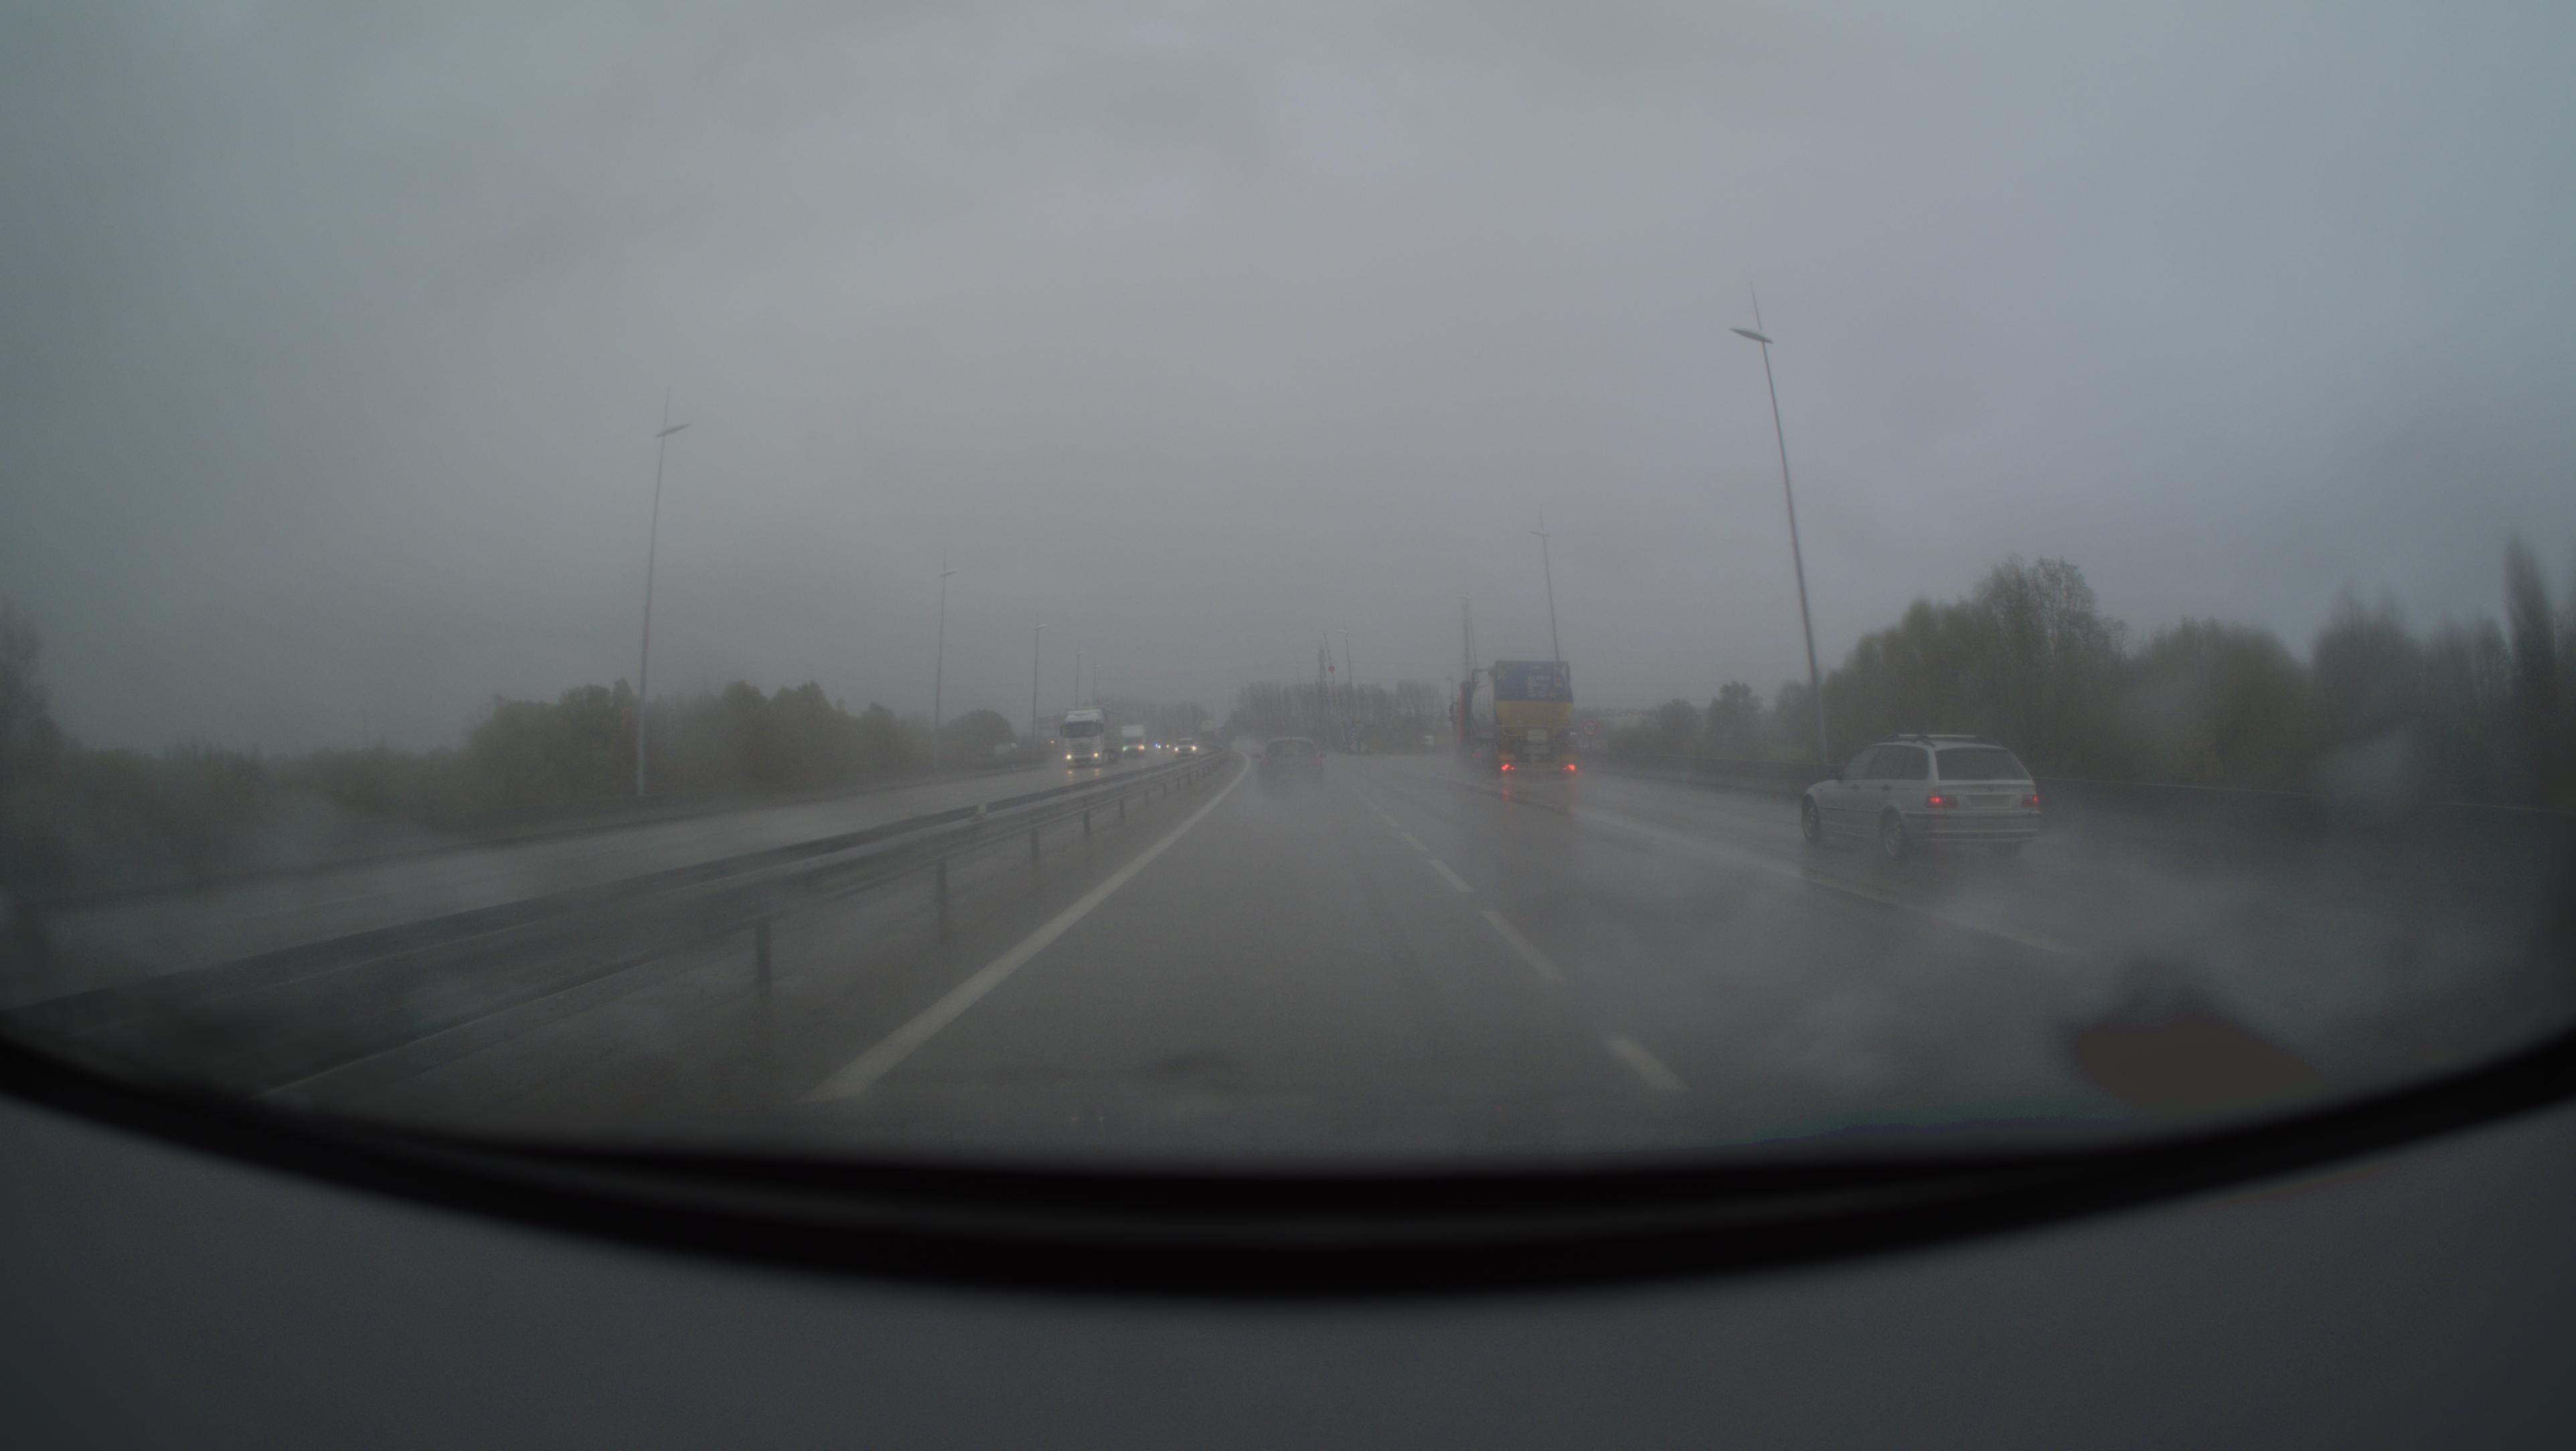
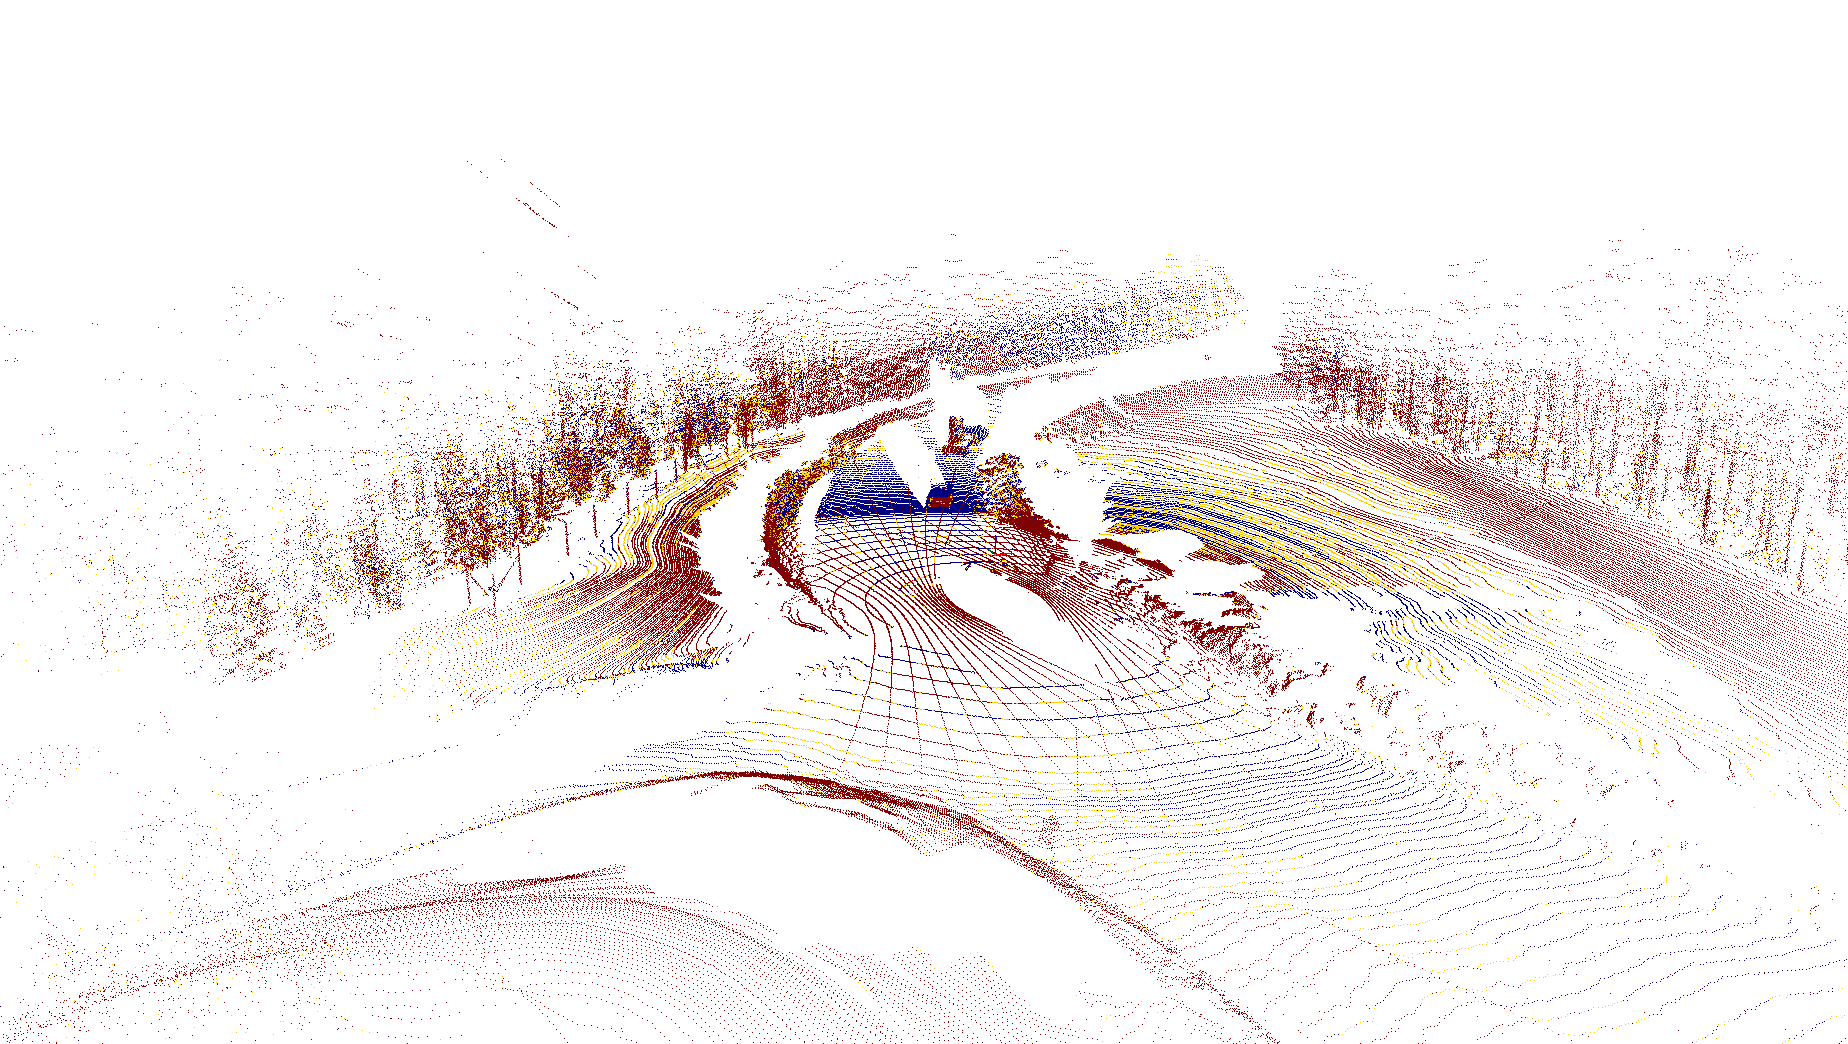
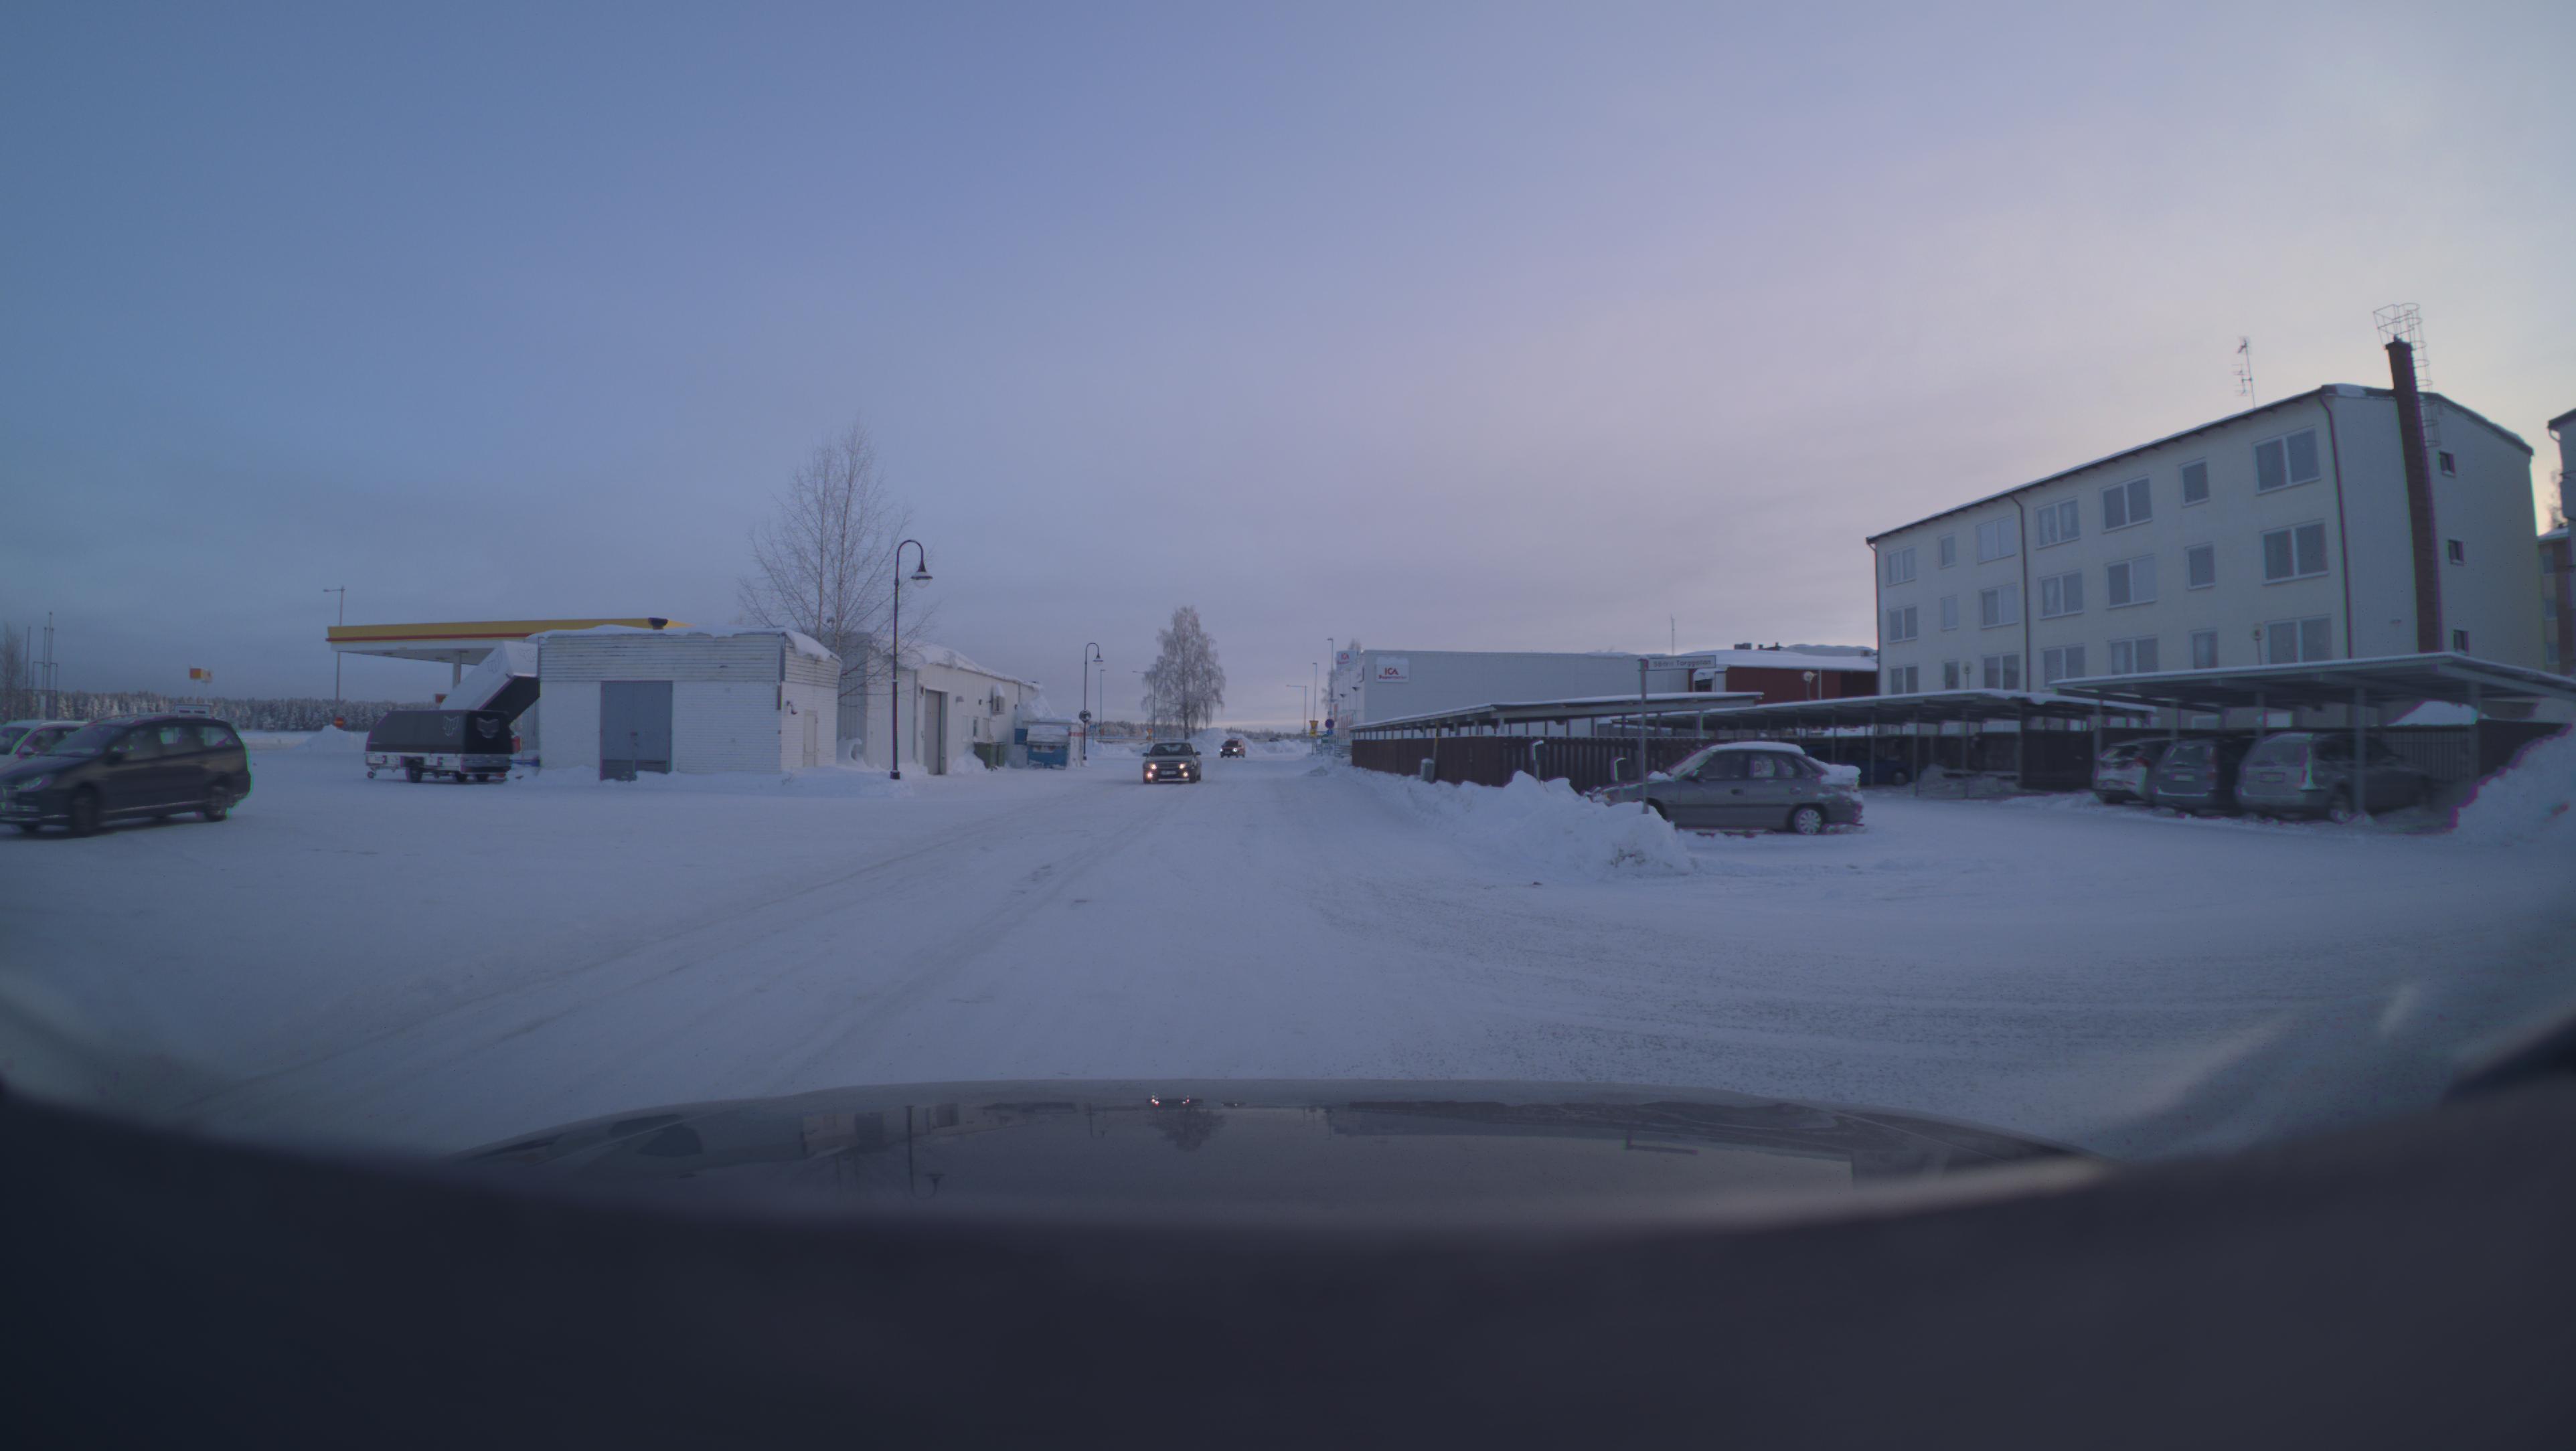
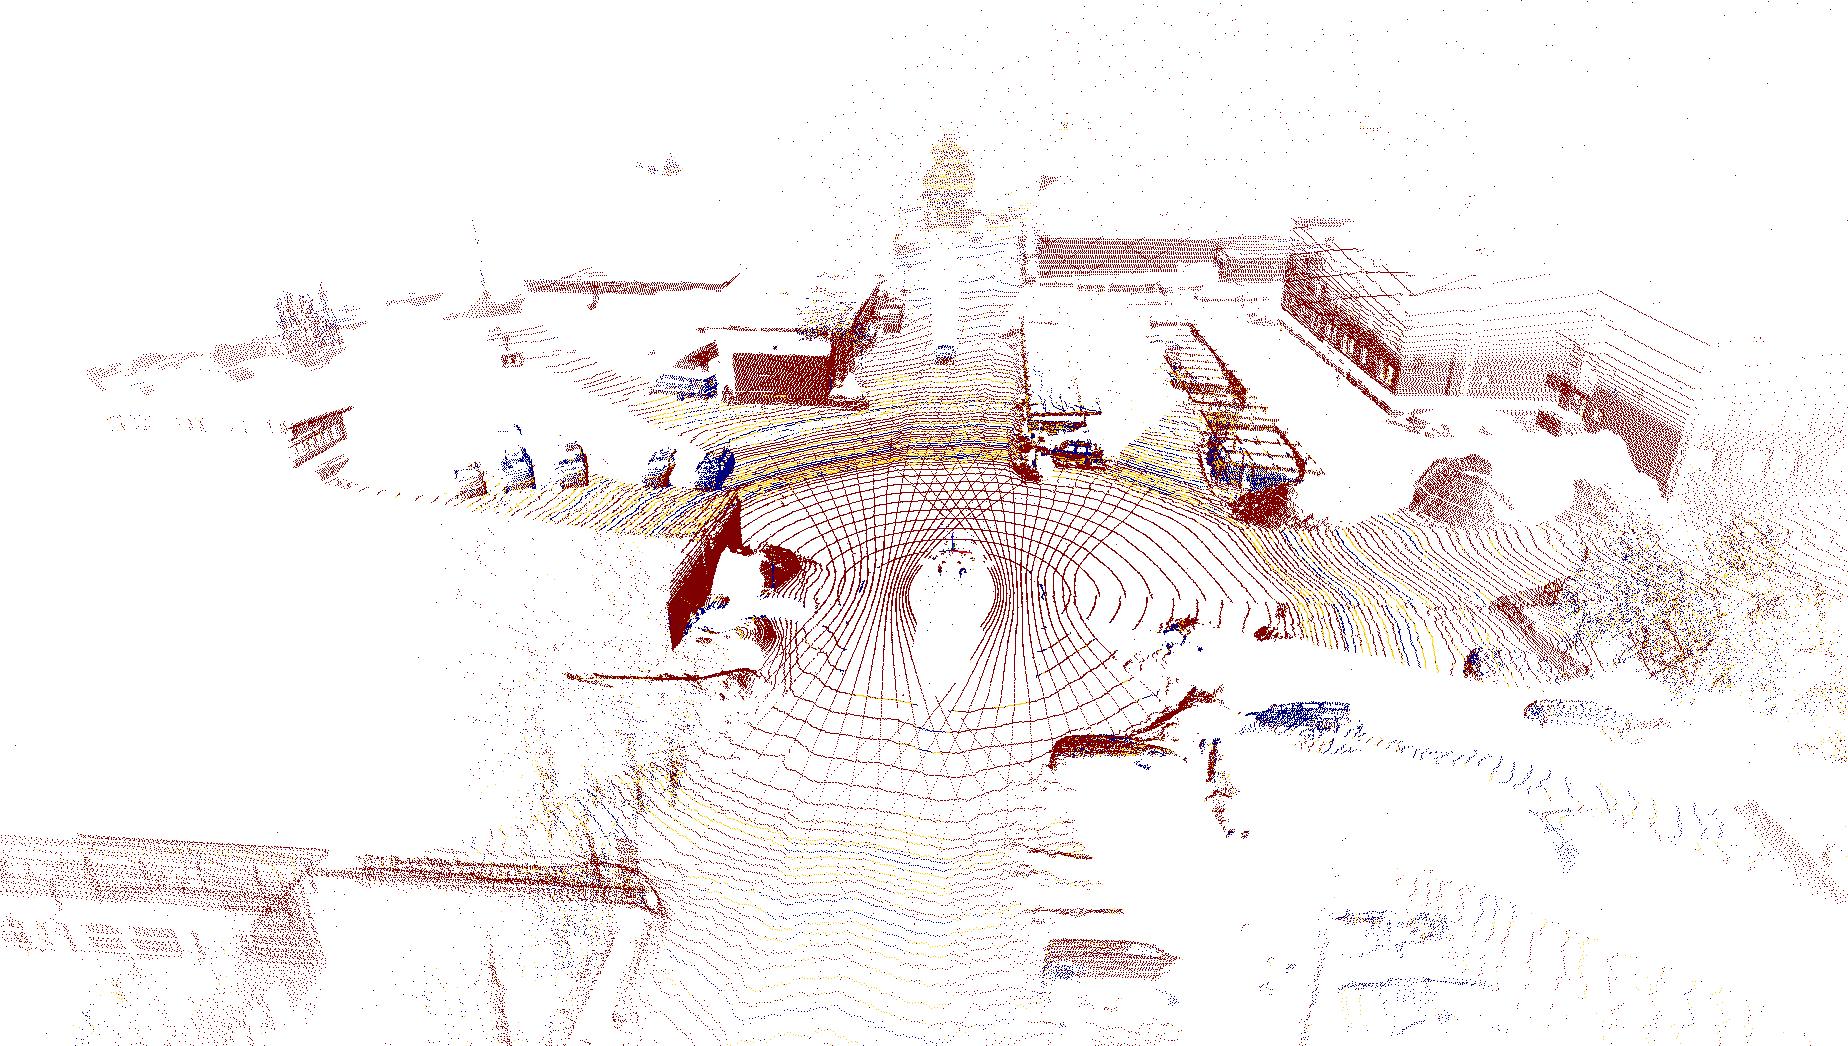
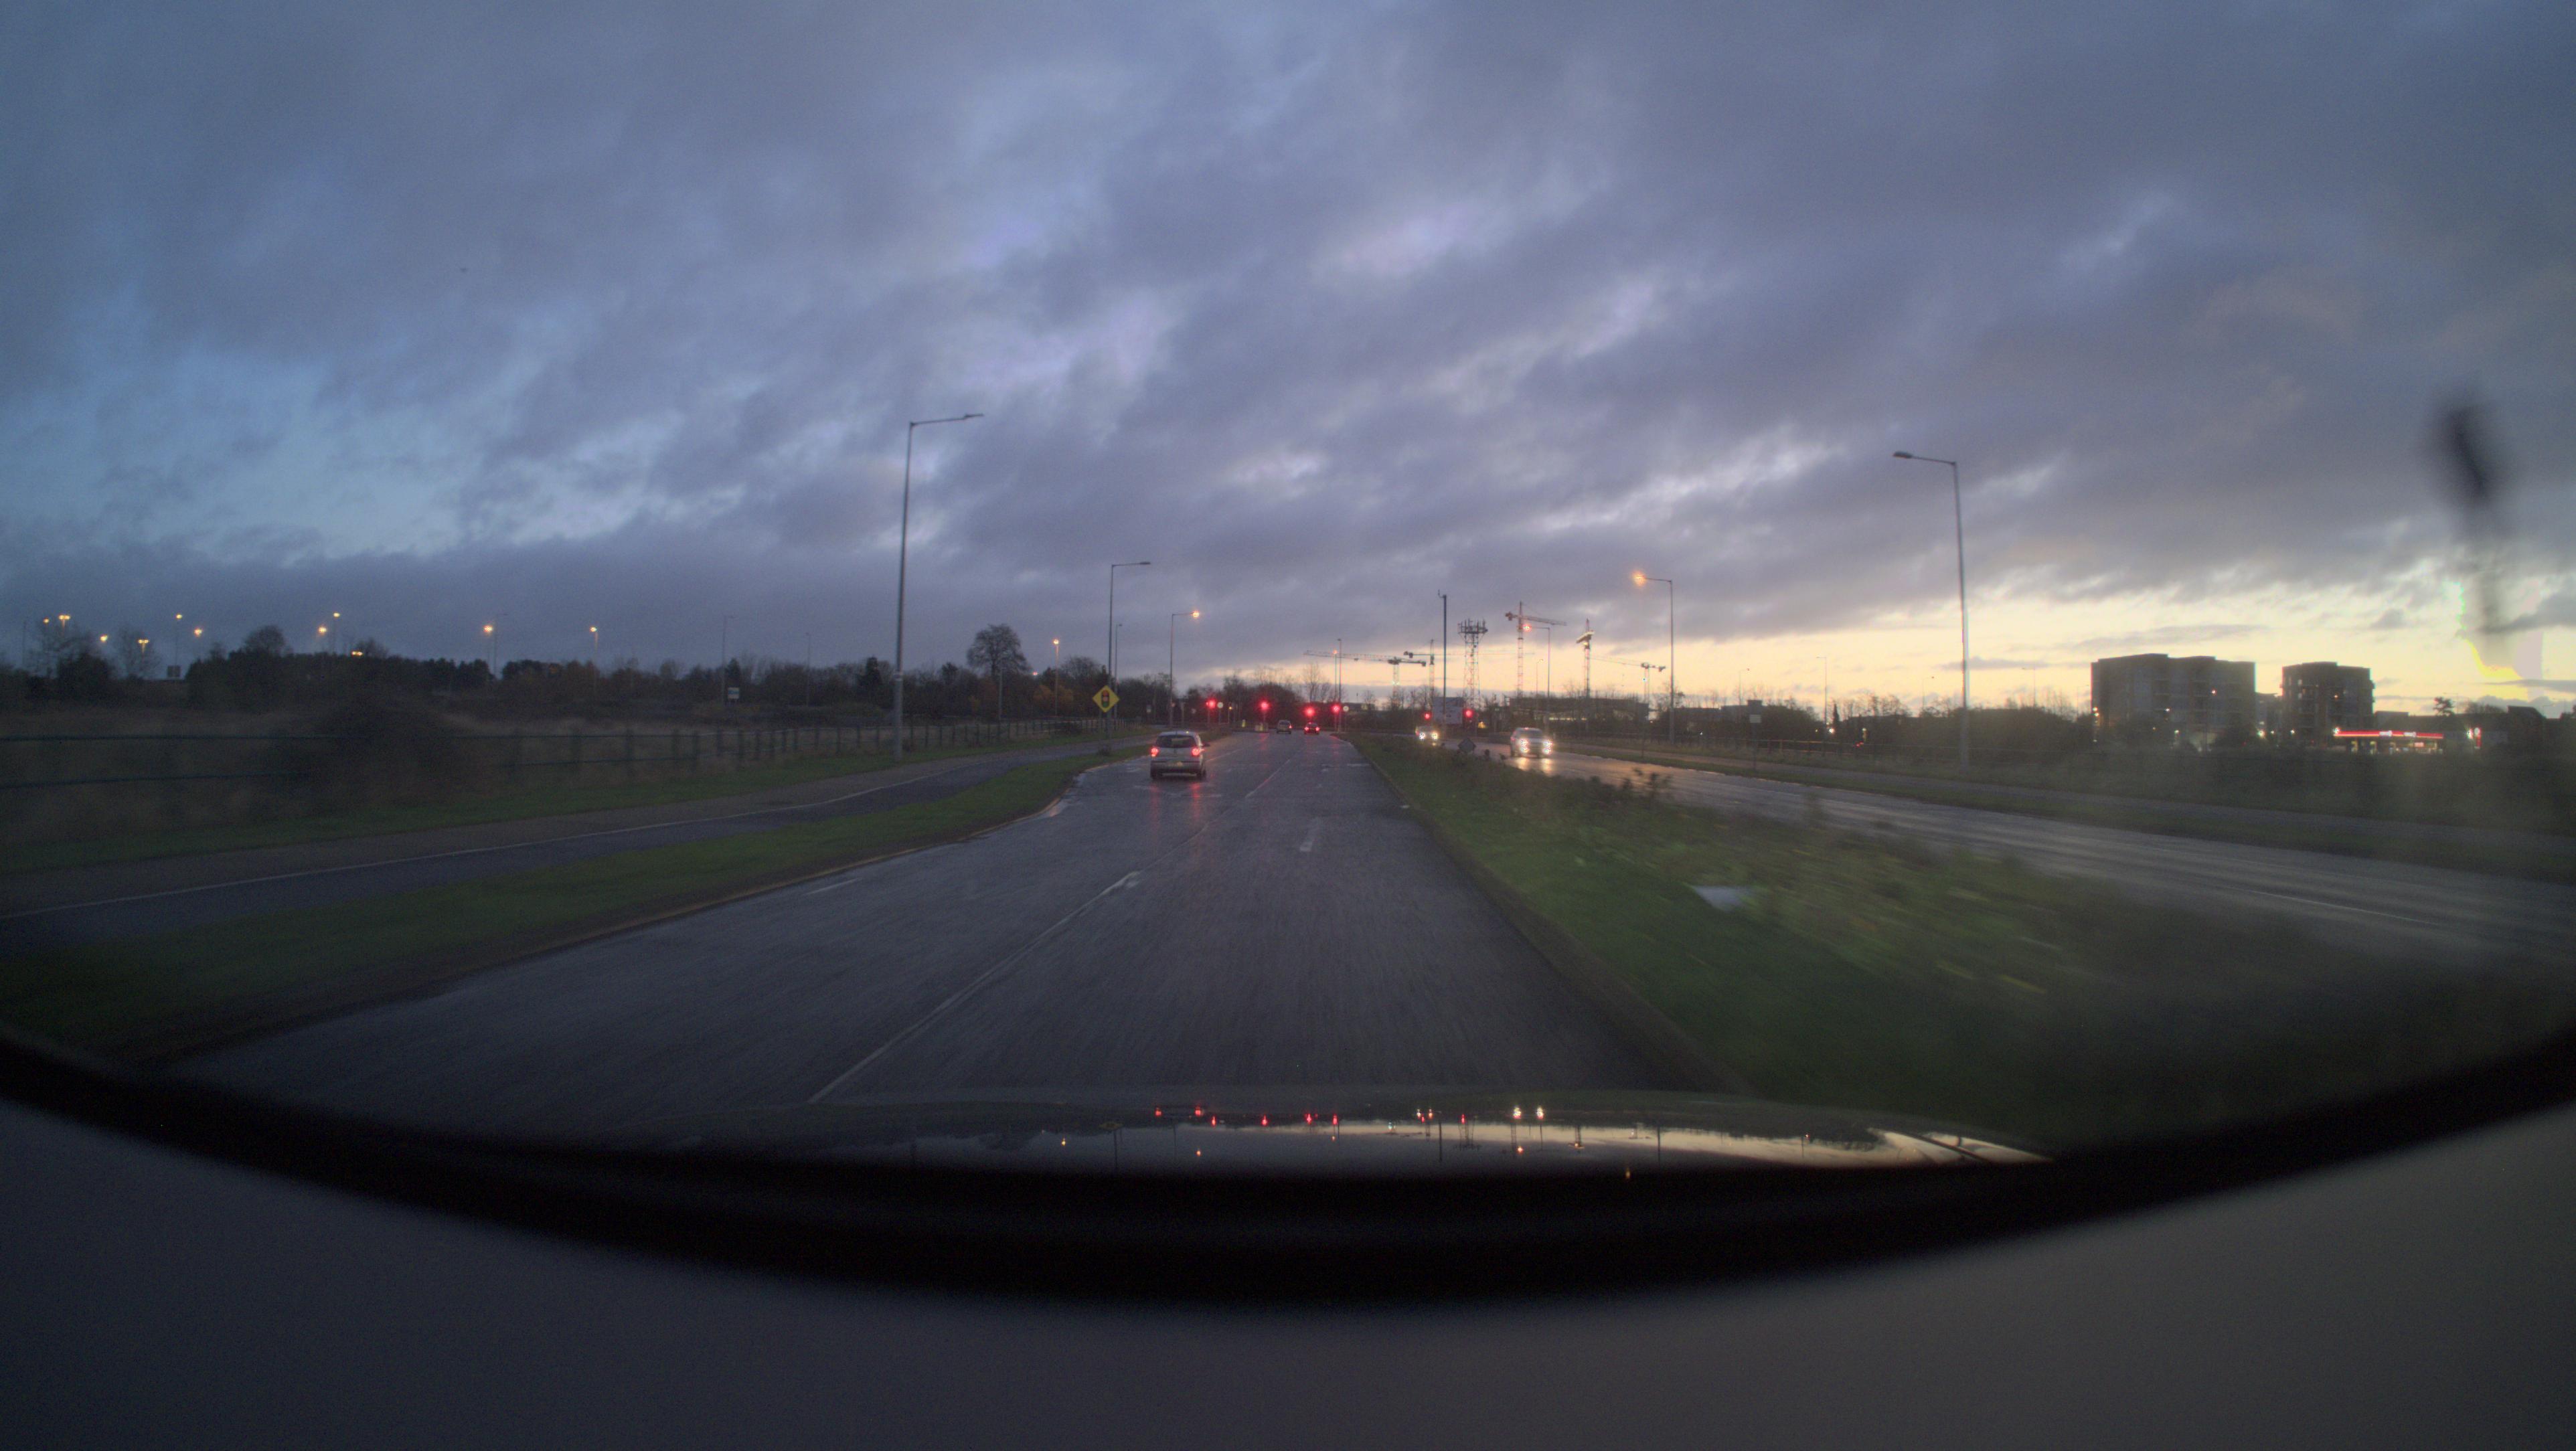
Data samples
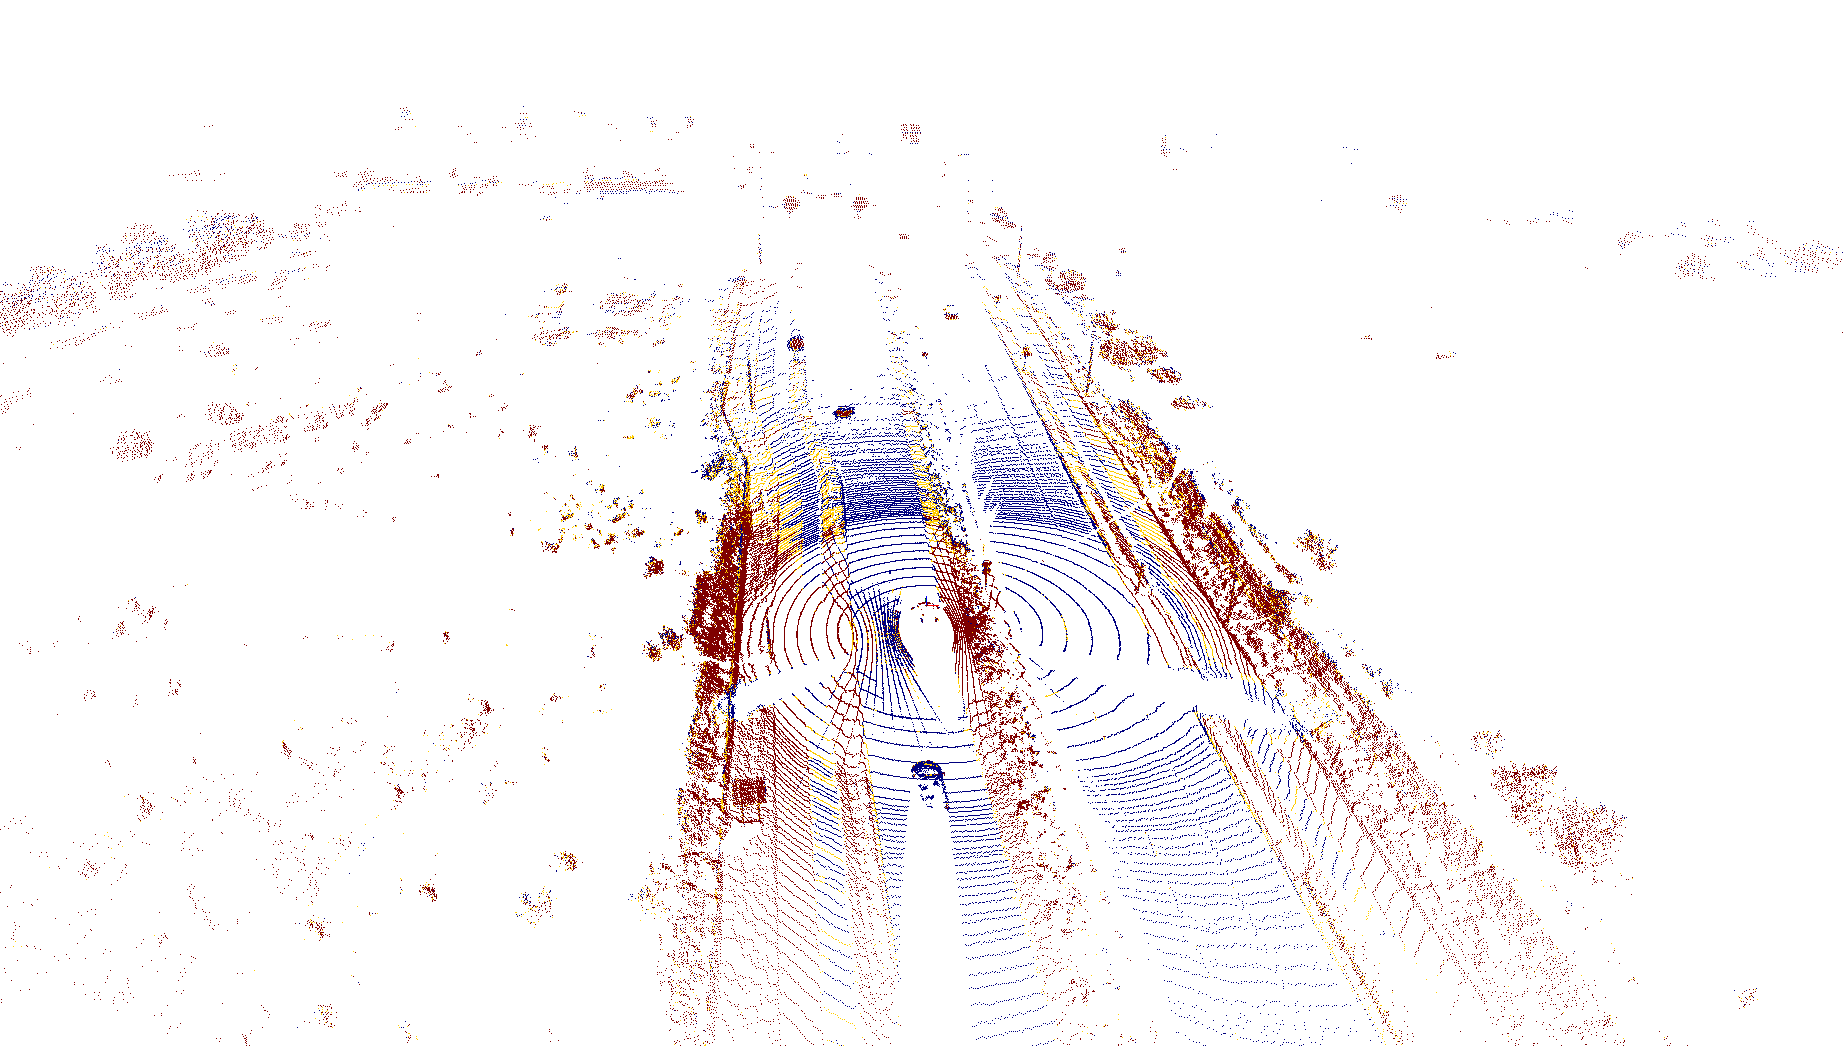
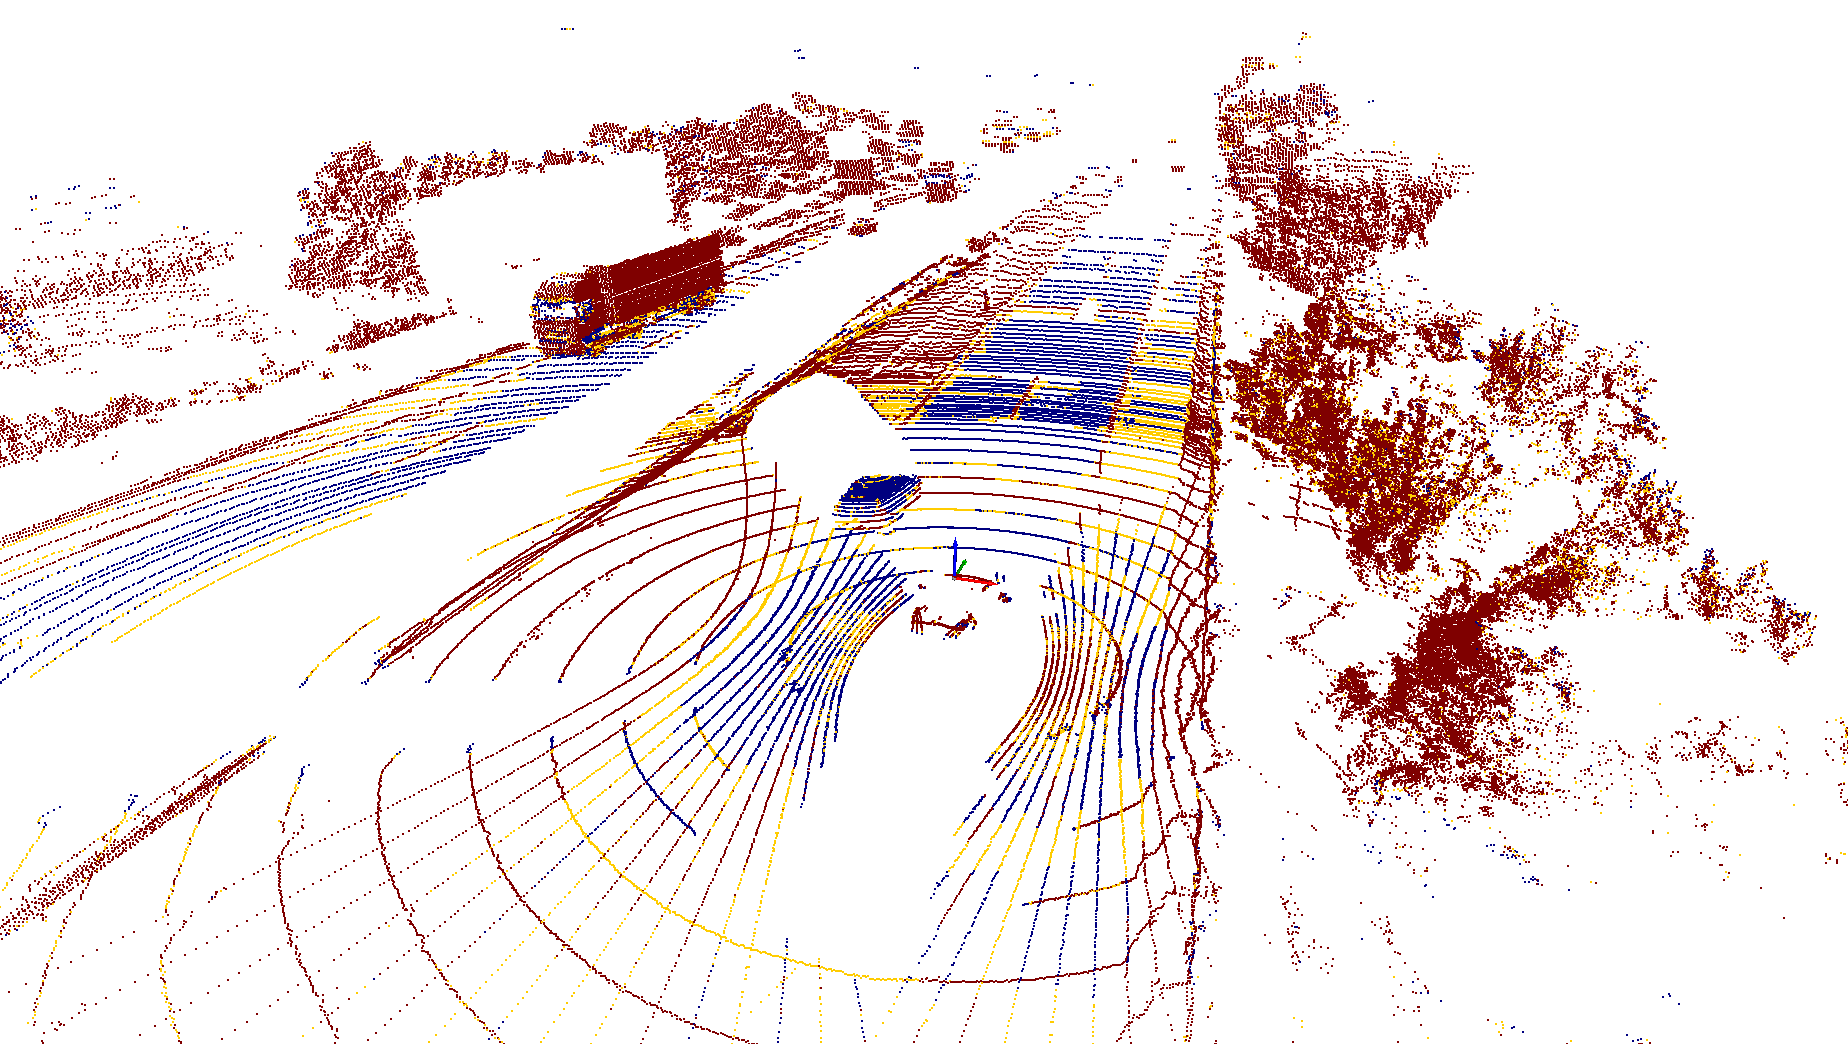
Here, we show some data samples from the dataset. We deliberately show scenes that reflect the diversity of the dataset, including scenes where the sensors are obscured by adverse weather.


Additional Statistics
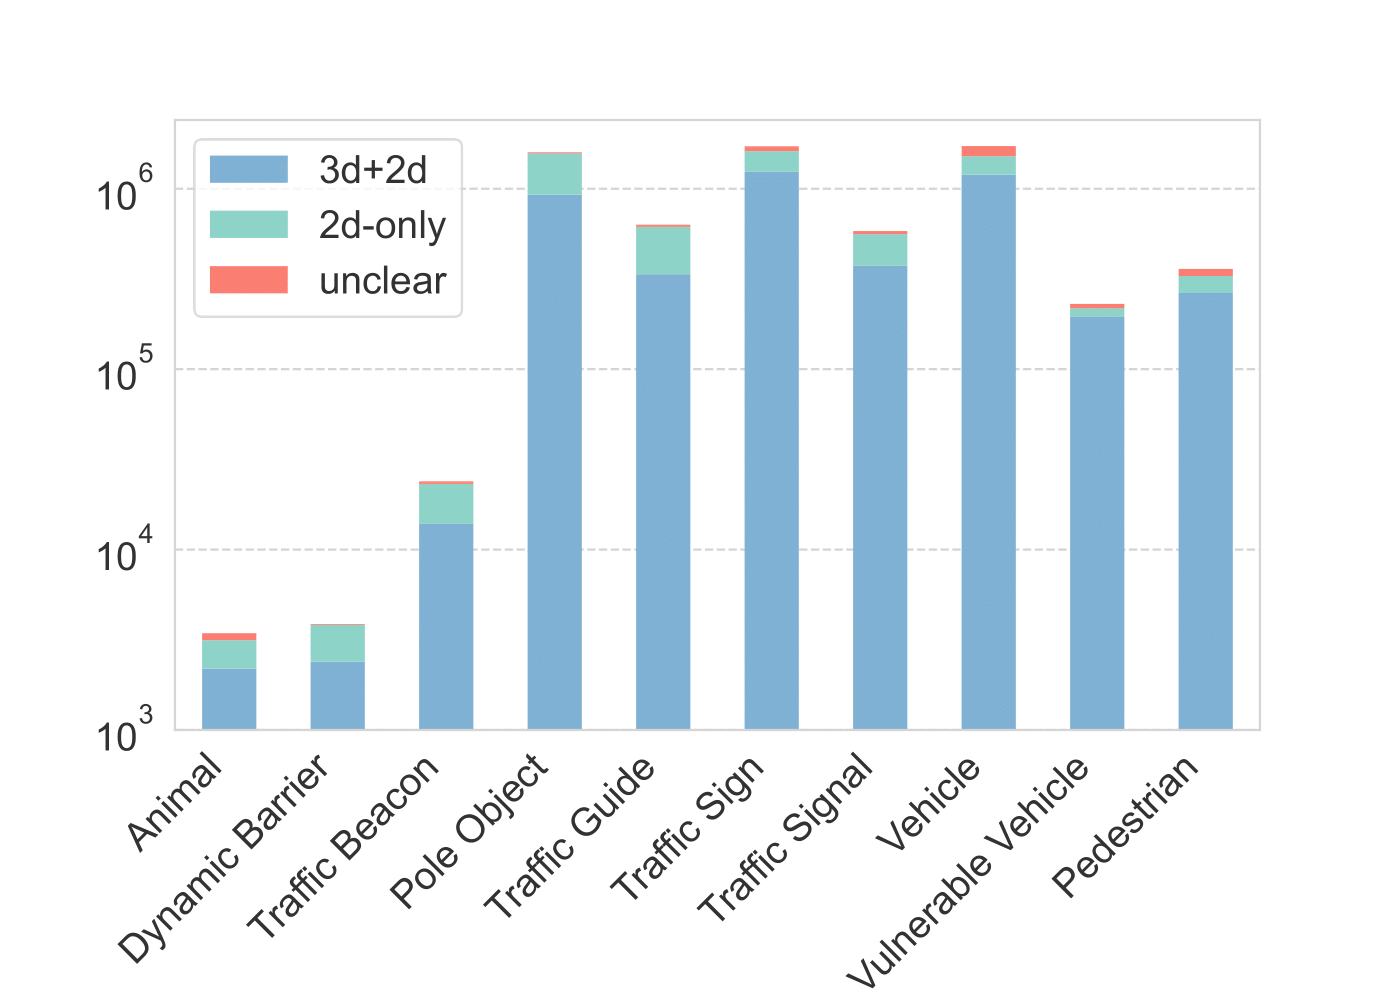
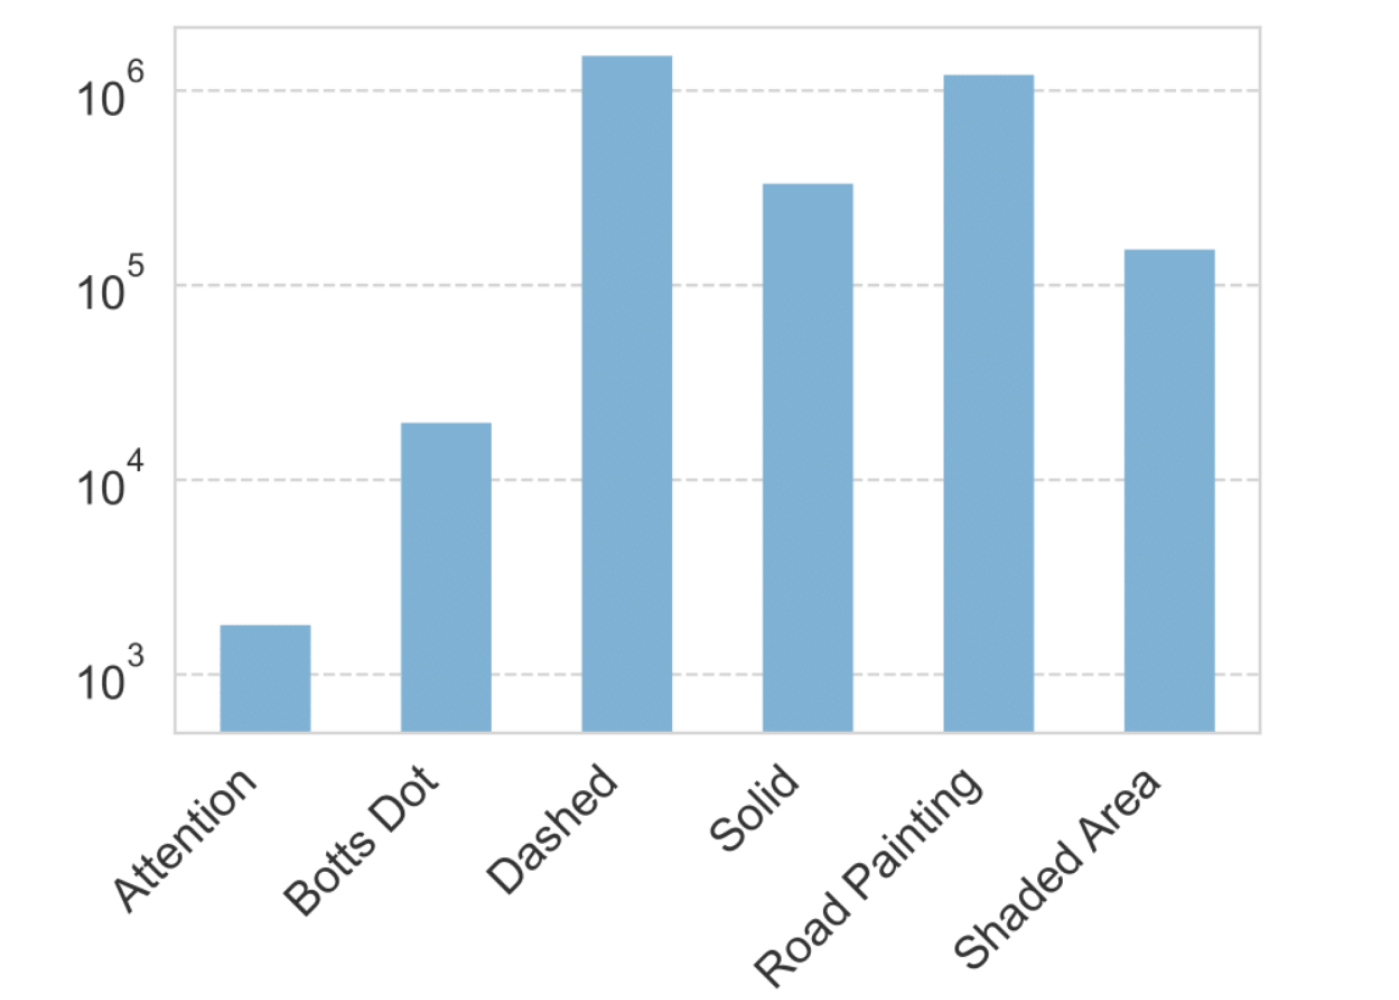
Here, we show some additional interesting statistics about the ZOD Frames dataset, starting with the number of annotated instances for Objects and Lanes.
ZOD Frames is collected from a wide range of traffic scenarios, including downtown areas, highways, and rural roads. This results in a varying number of objects in the scene, which is shown for the top-level classes Vehicle, VulnerableVehicle, and Pedestrian in the figure below.

-
Sun, Pei, et al. “Scalability in perception for autonomous driving: Waymo open dataset. alt=””” Proceedings of the IEEE/CVF conference on computer vision and pattern recognition. 2020. ↩ ↩2 ↩3
-
Caesar, Holger, et al. “nuScenes: A multimodal dataset for autonomous driving.” Proceedings of the IEEE/CVF conference on computer vision and pattern recognition. 2020. ↩ ↩2
-
Benjamin Wilson, et al. “Argoverse 2: Next Generation Datasets for Self-driving Perception and Forecasting alt=”””. In Proceedings of the Neural Information Processing Systems Track on Datasets and Benchmarks (NeurIPS Datasets and Benchmarks). 2021. ↩ ↩2